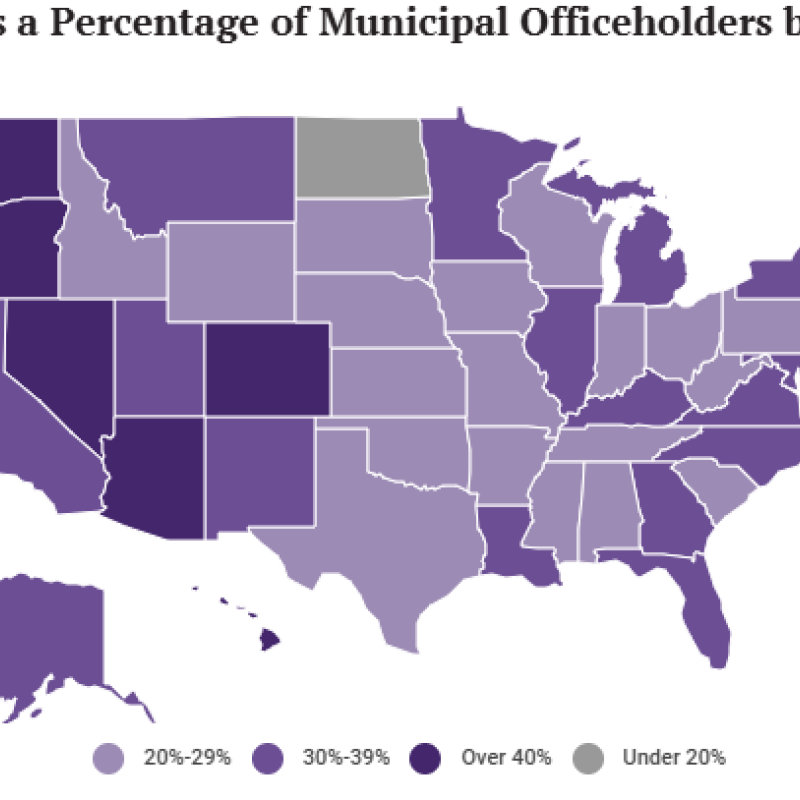
Current Numbers
Municipal Officeholders - Cities over 10,000
Data provided by the Center for American Women and Politics and KnowWho Data Services as of March 2025. Numbers include members and officers of the municipal legislative branch of incorporated cities and towns with populations over 10,000 as per the U.S. Census. These bodies vary by municipality, but include city councils, boards of alderman, city commissions, among others. Mayors and other officials who perform mayoral functions are included in these counts.
Mayors - Cities over 30,000
Population data from the U.S. Census and officeholder data from the Center for American Women and Politics as of February 2025.
Mayors – 100 Most Populous Cities
Of the 41 women mayors in the top 100 most populous cities as of January 2026, 9 are Black women, 3 are Latinas, and 5 are Asian American/Pacific Islander women.
Permission to Reproduce CAWP Materials
Reproduction of information on the CAWP website for non-commercial purposes is encouraged, provided that clear and visible credit is given to Center for American Women and Politics, Eagleton Institute of Politics, Rutgers University. Any information reproduced must include footnotes/endnotes that apply to that information. Commercial reproduction requires prior permission in writing from the Center for American Women and Politics. All CAWP fact sheets are available on this web site and may be downloaded and copied as needed.
How to Cite Our Information
Center for American Women and Politics (CAWP). 2026. “Local.” New Brunswick, NJ: Center for American Women and Politics, Eagleton Institute of Politics, Rutgers University-New Brunswick. https://cawp.rutgers.edu/data/levels-office/local (Accessed January 14, 2026)
Local — Municipal Officeholders
Current Numbers
Municipal Officeholders - Cities over 10,000
Data provided by the Center for American Women and Politics and KnowWho Data Services. Numbers include members and officers of the municipal legislative branch of incorporated cities and towns with populations over 10,000 as per the U.S. Census. These bodies vary by municipality, but include city councils, boards of alderman, city commissions, among others. Mayors and other officials who perform mayoral functions are included in these counts. Data is as of March 2025 and will be updated annually.
Permission to Reproduce CAWP Materials
Reproduction of information on the CAWP website for non-commercial purposes is encouraged, provided that clear and visible credit is given to Center for American Women and Politics, Eagleton Institute of Politics, Rutgers University. Any information reproduced must include footnotes/endnotes that apply to that information. Commercial reproduction requires prior permission in writing from the Center for American Women and Politics. All CAWP fact sheets are available on this web site and may be downloaded and copied as needed.
How to Cite Our Information
Center for American Women and Politics (CAWP). 2026. “Local.” New Brunswick, NJ: Center for American Women and Politics, Eagleton Institute of Politics, Rutgers University-New Brunswick. https://cawp.rutgers.edu/data/levels-office/local (Accessed January 14, 2026)
Mayors - Cities over 30,000
Current Numbers
Mayors - Cities over 30,000
As of February 2025, per CAWP research and population data from the U.S. Census. Includes the 1,686 mayors and officials who perform mayoral functions of U.S. cities, towns, and minor civil divisions with populations over 30,000. (Primary reference source: U.S. Census Population Data.)
Percent of Women Mayors of Cities over 30,000 1988-2025
Permission to Reproduce CAWP Materials
Reproduction of information on the CAWP website for non-commercial purposes is encouraged, provided that clear and visible credit is given to Center for American Women and Politics, Eagleton Institute of Politics, Rutgers University. Any information reproduced must include footnotes/endnotes that apply to that information. Commercial reproduction requires prior permission in writing from the Center for American Women and Politics. All CAWP fact sheets are available on this web site and may be downloaded and copied as needed.
How to Cite Our Information
Center for American Women and Politics (CAWP). 2026. “Local.” New Brunswick, NJ: Center for American Women and Politics, Eagleton Institute of Politics, Rutgers University-New Brunswick. https://cawp.rutgers.edu/data/levels-office/local (Accessed January 14, 2026)
Mayors - 100 Most Populous Cities
Current Numbers
Mayors - 100 Most Populous Cities
Of the 41 women mayors in the top 100 most populous cities as of January 2026, 8 (19.5%) are Black women, 4 (9.8%) are Latinas, and 5 (12.2%) are Asian American/Pacific Islander women.
History of Mayors of the Top 100 Most Populous Cities by Race/Ethnicity
A full historic listing of white mayors is not available. Any other racial/ethnic categories missing indicate that there have not been any women mayors of that group in the top 100 most populous cities.
Asterisks (*) indicate a mayor was elected in a non-partisan race.
Asian American/Pacific Islander Women Mayors
10
(7D, 2R, 1L)
Black Women Mayors
27
(27D)
Footnote
**Sharon Weston Broome served as Mayor of Baton Rouge but it is no longer in the top 100 most populated cities according to the 2019 U.S. Census data.
Latina Mayors
6
(5D, 1Ind)
Why do we collect data on women officeholders by race and ethnicity?
Since our founding in 1971, a primary initiative of the Center for American Women and Politics (CAWP) has been our collection and public reporting of data on women officeholders and, more recently, candidates. This data has been imperative to revealing the underrepresentation of women across levels of elected office in the United States and motivating efforts to increase women’s political power. Consistent with these goals, CAWP began collecting data on women officeholders by race and ethnicity in 1997 to document the disparities in women’s representation by race and ethnicity, as well as make clearer the persistent underrepresentation of women within historically marginalized racial and ethnic groups. These motivations continue to guide CAWP’s data collection and public reporting.
What do we mean by race and ethnicity?
CAWP’s data collection and public reporting has historically combined race and ethnicity based in our recognition that these identifications, as well as their influence on individual and group experiences, are not wholly separable and are rooted in complex social constructions. As our earliest coding aligned with the U.S. Census (see below), we approach our racial and ethnic identification measurement with the U.S. Census recognition that the categories we use “reflect a social definition of race recognized in this country and not an attempt to define race biologically, anthropologically, or genetically.” Ethnicity, when distinguished from race, often denotes shared culture, such as language, ancestry, practices, and beliefs. In a slight departure from the U.S. Census, to date we have not distinguished race from ethnicity in our reporting, as is most notable in our inclusion of Latina among all racial/ethnic categories. The U.S. Census has considered including Latino/a as a racial category. Likewise, they have considered but not adopted inclusion of Middle Eastern/North African among racial categories, which we now include in our data.
How do we report data by race and ethnicity? Has this changed over time?
CAWP has reported summary data on women officeholders and candidates by race/ethnicity since 1997. Prior to 2021, we reported this data under the category of “women of color,” presenting aggregate counts of women with self-identified races and ethnicities other than white with sub-counts by each racial/ethnic group (including one group for any women who identified as multiracial). While this approach was consistent with CAWP’s interest in challenging the myth that women are not monolithic, it centered whiteness as a default racial/ethnic category.
In our current reporting, beginning in 2021, we provide more detailed counts of women by racial and ethnic groups, including white women. In our current pages for women officeholders by race and ethnicity, we also offer more detailed current and historic data on Asian American/Pacific Islander, Black, Latina, Middle Eastern/North African, and Native American/Alaska Native/Native Hawaiian, and white women officeholders. CAWP added Middle Eastern/North African as a category of self-identification starting in 2019. We also included Alaska Native as a category for self-identification for the first time in 2019 and Native Hawaiian as a category for self-identification for the first time in 2021 providing greater specificity for native peoples within the United States. While these racial and ethnic categories are themselves imperfect and subject to change, we adopt these categories provisionally and in alignment with both the U.S. Census and CAWP’s historical race and ethnicity data collection. We will periodically revisit these categories to reflect current understandings of racial and ethnic identification.
In our current reporting, women who self-identify as more than one race and ethnicity are included in each group with which they identify. If officeholders choose to identify as “multiracial” alone, without specifying any unique racial and ethnic identifications, they are categorized as such in CAWP’s database and reporting. We strongly caution against adding totals from each racial/ethnic group should, as it will double count officeholders. To conduct more detailed calculations, users should refer to CAWP’s Women Elected Officials Database. For those choosing to report an aggregate count of “women of color,” including any women with racial/ethnic identities other than white, please refer to the database search tool by race/ethnicity (and select all but white and unavailable) or contact CAWP staff directly.
How do we collect racial/ethnic identification data?
Officeholder race/ethnicity is coded by a team of CAWP researchers in two ways. First, we rely on officeholder self-identification through direct contact (via email, phone, or social media). In direct exchanges with officeholders (whether at the candidate or officeholder stage), we provide them with information about why we collect this data, where it will be publicly reported, and how it will be used. We then provide a list of racial/ethnic categories, asking them to choose which (one or multiple) best reflect their racial/ethnic identification. Currently, we include the following racial/ethnic categories in our requests for self-identification: Asian or Pacific Islander, Black/African American, Hispanic/Latina, Middle Eastern/North African, Native American/Alaska Native, Native Hawaiian, White. We note that if none of these categories capture how an individual identifies that they should provide their preferred self-identification.
Where self-identification is not provided to us directly, we rely on historical and/or contemporary public records (e.g. websites, social media, interviews) that include statements of racial/ethnic self-identification by the officeholder. In a small number of cases where other indicators of racial/ethnic identification are publicly available, we use a multiple source verification process for coding. After exhausting these efforts, we label officeholders for whom we were unable to determine racial/ethnic identification as “unavailable.”
Permission to Reproduce CAWP Materials
Reproduction of information on the CAWP website for non-commercial purposes is encouraged, provided that clear and visible credit is given to Center for American Women and Politics, Eagleton Institute of Politics, Rutgers University. Any information reproduced must include footnotes/endnotes that apply to that information. Commercial reproduction requires prior permission in writing from the Center for American Women and Politics. All CAWP fact sheets are available on this web site and may be downloaded and copied as needed.
How to Cite Our Information
Center for American Women and Politics (CAWP). 2026. “Local.” New Brunswick, NJ: Center for American Women and Politics, Eagleton Institute of Politics, Rutgers University-New Brunswick. https://cawp.rutgers.edu/data/levels-office/local (Accessed January 14, 2026)