
All State Legislature
Current Numbers:
Methodological Statement on Race and Ethnicity
Since our founding in 1971, a primary initiative of the Center for American Women and Politics (CAWP) has been our collection and public reporting of data on women officeholders and, more recently, candidates. This data has been imperative to revealing the underrepresentation of women across levels of elected office in the United States and motivating efforts to increase women’s political power. Consistent with these goals, CAWP began collecting data on women officeholders by race and ethnicity in 1997 to document the disparities in women’s representation by race and ethnicity, as well as make clearer the persistent underrepresentation of women within historically marginalized racial and ethnic groups. These motivations continue to guide CAWP’s data collection and public reporting.
CAWP’s data collection and public reporting has historically combined race and ethnicity based in our recognition that these identifications, as well as their influence on individual and group experiences, are not wholly separable and are rooted in complex social constructions. As our earliest coding aligned with the U.S. Census (see below), we approach our racial and ethnic identification measurement with the U.S. Census recognition that the categories we use “reflect a social definition of race recognized in this country and not an attempt to define race biologically, anthropologically, or genetically.” Ethnicity, when distinguished from race, often denotes shared culture, such as language, ancestry, practices, and beliefs. In a slight departure from the U.S. Census, to date we have not distinguished race from ethnicity in our reporting, as is most notable in our inclusion of Latina among all racial/ethnic categories. The U.S. Census has considered including Latino/a as a racial category. Likewise, they have considered but not adopted inclusion of Middle Eastern/North African among racial categories, which we now include in our data.
CAWP has reported summary data on women officeholders and candidates by race/ethnicity since 1997. Prior to 2021, we reported this data under the category of “women of color,” presenting aggregate counts of women with self-identified races and ethnicities other than white with sub-counts by each racial/ethnic group (including one group for any women who identified as multiracial). While this approach was consistent with CAWP’s interest in challenging the myth that women are not monolithic, it centered whiteness as a default racial/ethnic category.
In our current reporting, beginning in 2021, we provide more detailed counts of women by racial and ethnic groups, including white women. In our current pages for women officeholders by race and ethnicity, we also offer more detailed current and historic data on Asian American/Pacific Islander, Black, Latina, Middle Eastern/North African, and Native American/Alaska Native/Native Hawaiian, and white women officeholders. CAWP added Middle Eastern/North African as a category of self-identification starting in 2019. We also included Alaska Native as a category for self-identification for the first time in 2019 and Native Hawaiian as a category for self-identification for the first time in 2021, providing greater specificity for native peoples within the United States. While these racial and ethnic categories are themselves imperfect and subject to change, we adopt these categories provisionally and in alignment with both the U.S. Census and CAWP’s historical race and ethnicity data collection. We will periodically revisit these categories to reflect current understandings of racial and ethnic identification.
In our current reporting, women who self-identify as more than one race and ethnicity are included in each group with which they identify. If officeholders choose to identify as “multiracial” alone, without specifying any unique racial and ethnic identifications, they are categorized as such in CAWP’s database and reporting. We strongly caution against adding totals from each racial/ethnic group should, as it will double count officeholders. To conduct more detailed calculations, users should refer to CAWP’s Women Elected Officials Database. For those choosing to report an aggregate count of “women of color,” including any women with racial/ethnic identities other than white, please refer to the database search tool by race/ethnicity (and select all but white and unavailable) or contact CAWP staff directly.
Officeholder race/ethnicity is coded by a team of CAWP researchers in two ways. First, we rely on officeholder self-identification through direct contact (via email, phone, or social media). In direct exchanges with officeholders (whether at the candidate or officeholder stage), we provide them with information about why we collect this data, where it will be publicly reported, and how it will be used. We then provide a list of racial/ethnic categories, asking them to choose which (one or multiple) best reflect their racial/ethnic identification. Currently, we include the following racial/ethnic categories in our requests for self-identification: Asian or Pacific Islander, Black/African American, Hispanic/Latina, Middle Eastern/North African, Native American/Alaska Native, Native Hawaiian, white. We note that if none of these categories capture how an individual identifies that they should provide their preferred self-identification.
Where self-identification is not provided to us directly, we rely on historical and/or contemporary public records (e.g. websites, social media, interviews) that include statements of racial/ethnic self-identification by the officeholder. In a small number of cases where other indicators of racial/ethnic identification are publicly available, we use a multiple source verification process for coding. After exhausting these efforts, we label officeholders for whom we were unable to determine racial/ethnic identification as “unavailable.”
Looking for information about former and current women serving in State Legislatures?
Check out our full database, where you can find more detailed information on individuals and search by position, race/ethnicity, and party.
Facts
Majority-Woman and Gender Parity Legislatures and Chambers
Lists below distinguish between states that have already achieved gender parity (50% women) or majority-woman status (women >50%) in the state legislature as a whole and/or within a single state legislative chamber. Counts indicate the total number of states that have achieved this status in the past and/or at present.
Overall Legislature
4
Current:
Colorado, first hit in 2025 (majority-woman)
Nevada, first hit in 2018 (majority-woman)
New Mexico, first hit in 2023 (majority-woman)
Past:
Arizona, first hit in 2023 (majority-woman)
Colorado, first hit in 2023 (gender parity)
Senate Only
5
Current:
Arizona, first hit in 2021 (majority-woman)
California, first hit in 2025 (majority-woman)
Nevada, first hit in 2023 (majority-woman)
Past:
New Hampshire, first hit in 2009 (majority-woman)
New Hampshire, first hit in 2023 (gender parity)
Rhode Island, first hit in 2021 (gender parity)
Arizona, first hit in 2021 (majority-woman)
House/Assembly Only
6
Current:
Alaska, first hit in 2025 (gender parity)
Colorado, first hit in 2019 (majority-woman)
Nevada, first hit in 2018 (majority-woman)
New Mexico, first hit in 2021 (majority-woman)
Past:
Arizona, first hit in 2024 (gender parity)
Oregon, first hit in 2021 (majority-woman)
Alaska, first hit in 2025 (majority-woman)
Party Breakdown of Current Women State Legislators
Footnote
*In Nebraska, where the legislature is unicameral, legislators are elected on a nonpartisan basis.
Top 10 and Bottom 10 States by Women as a Percentage of State Legislators
Top States
Nevada (61.9%)
New Mexico (54.5%)
Colorado (52.0%)
California (49.2%)
Arizona (48.9%)
Oregon (45.6%)
Washington (44.9%)
Illinois (44.1%)
Vermont (43.3%)
Florida (42.5%)
Rhode Island (42.5%)
Bottom States
West Virginia (11.9%)
South Carolina (14.1%)
Mississippi (15.5%)
Tennessee (17.4%)
Alabama (18.6%)
Arkansas (20.7%)
Oklahoma (23.5%)
Louisiana (23.6%)
North Dakota (24.8%)
Wyoming (25.8%)
State by State Ranking of Current Women Legislators
| State | State Rank | Senate | Total Women/Total Senate | House | Total Women/Total House | Total Women/Total Legislators | % Women Overall |
|---|---|---|---|---|---|---|---|
| AL | 46 | 3D, 1R | 4/35 | 11D, 11R | 22/105 | 26/140 | 18.6 |
| AK | 13 | 2D, 3R | 5/20 | 9D, 9R, 2Ind | 20/40 | 26/60 | 43.3 |
| AZ | 5 | 11D, 5R | 16/30 | 18D, 10R | 28/60 | 44/90 | 48.9 |
| AR | 45 | 2D, 3R | 5/35 | 8D, 15R | 23/100 | 28/135 | 20.7 |
| AS | N/A | 0 | 0/18 | 2 NP | 2/21 | 2/39 | 5.1 |
| CA | 4 | 16D, 5R | 21/40 | 31D, 7R | 38/80 | 59/120 | 49.2 |
| CO | 3 | 10D, 4R | 14/35 | 31D, 6R | 37/65 | 52/100 | 52.0 |
| CT | 21 | 10D, 1R | 11/36 | 40D, 16R | 56/151 | 67/187 | 35.8 |
| DC | N/A | 4D, 1Ind | 5/13 | n/a | -unicameral- | 5/13 | 38.5 |
| DE* | 18 | 6D, 0R | 6/21 | 16D, 1R | 17/41 | 23/62 | 37.1 |
| FL* | 10 | 7D, 9R | 16/40 | 21D, 31R | 52/120 | 68/160 | 42.5 |
| GA | 31 | 10D, 1R | 11/56 | 46D, 19R | 65/180 | 76/236 | 32.2 |
| GU | N/A | 3D, 3R | 6/15 | n/a | -unicameral- | 6/15 | 40.0 |
| HI | 12 | 8D, 1R | 9/25 | 19D, 4R | 23/51 | 32/76 | 42.1 |
| ID | 39 | 4D, 8R | 12/35 | 6D, 11R | 17/70 | 29/105 | 27.6 |
| IL | 8 | 19D, 6R | 25/59 | 45D, 8R | 53/118 | 78/177 | 44.1 |
| IN | 40 | 3D, 7R | 10/50 | 15D, 15R | 30/100 | 40/150 | 26.7 |
| IA | 36 | 8D, 7R | 15/50 | 15D, 14R | 29/100 | 44/150 | 29.3 |
| KS* | 28 | 5D, 7R | 12/40 | 21D, 22R | 43/125 | 55/165 | 33.3 |
| KY | 35 | 3D, 5R | 8/38 | 13D, 20R | 33/100 | 41/138 | 29.7 |
| LA | 43 | 2D, 3R | 5/39 | 12D, 17R | 29/105 | 34/144 | 23.6 |
| ME | 14 | 12D, 3R | 15/35 | 41D, 21R, 1NP | 62/151 | 77/186 | 41.4 |
| MD | 15 | 13D, 1R | 14/47 | 55D, 7R | 62/141 | 76/188 | 40.4 |
| MA* | 33 | 11D, 1R | 12/40 | 44D, 3R, 1I | 48/160 | 60/200 | 30.0 |
| MI | 17 | 11D, 3R | 14/38 | 29D, 15R | 44/110 | 58/148 | 39.2 |
| MN | 20 | 18D, 4R | 22/67 | 36D, 16R | 52/134 | 74/201 | 36.8 |
| MS | 48 | 4D, 5R | 9/52 | 7D, 9R, 2I | 18/122 | 27/174 | 15.5 |
| MO | 37 | 6D, 4R | 10/34 | 27D, 20R | 47/163 | 57/197 | 28.9 |
| MP | N/A | 1D, 1Ind | 2/9 | 1D, 2I | 3/20 | 5/29 | 17.2 |
| MT* | 24 | 11D, 5R | 16/50 | 19D, 17R | 36/100 | 52/150 | 34.7 |
| NE | 38 | 14NP | 14/49 | n/a | -unicameral- | 14/49 | 28.6 |
| NV | 1 | 9D, 4R | 13/21 | 19D, 7R | 26/42 | 39/63 | 61.9 |
| NH | 23 | 5D, 5R | 10/24 | 82D, 58R | 140/400 | 150/424 | 35.4 |
| NJ* | 33 | 7D, 2R | 9/40 | 24D, 3R | 27/80 | 36/120 | 30.0 |
| NM | 2 | 13D, 3R | 16/42 | 34D, 11R | 45/70 | 61/112 | 54.5 |
| NY* | 24 | 19D, 3R | 22/63 | 49D, 3R | 52/150 | 74/213 | 34.7 |
| NC | 32 | 12D, 4R | 16/50 | 27D, 9R | 36/120 | 52/170 | 30.6 |
| ND | 42 | 1D, 8R | 9/47 | 8D, 18R | 26/94 | 35/141 | 24.8 |
| OH | 22 | 4D, 6R | 10/33 | 18D, 19R | 37/99 | 47/132 | 35.6 |
| OK | 44 | 6D, 8R | 14/48 | 11D, 10R | 21/101 | 35/149 | 23.5 |
| OR | 6 | 9D, 3R | 12/30 | 19D, 10R | 29/60 | 41/90 | 45.6 |
| PA | 27 | 9D, 10R | 19/50 | 39D, 27R | 66/203 | 85/253 | 33.6 |
| PR | N/A | 12Ind | 12/28 | 16Ind | 16/51 | 28/79 | 35.4 |
| RI* | 10 | 15D, 2R | 17/38 | 29D, 2R | 31/75 | 48/113 | 42.5 |
| SC | 49 | 2D, 0R | 2/46 | 9D, 13R | 22/124 | 24/170 | 14.1 |
| SD* | 18 | 2D, 10R | 12/35 | 3D, 24R | 27/70 | 39/105 | 37.1 |
| TN | 47 | 5D, 3R | 8/33 | 5D, 10R | 15/99 | 23/132 | 17.4 |
| TX | 26 | 4D, 4R | 8/31 | 33D, 20R | 53/150 | 61/181 | 33.7 |
| UT | 30 | 5D, 2R, 1I | 8/29 | 9D, 17R | 26/75 | 34/104 | 32.7 |
| VI | N/A | 2D, 1Ind | 3/15 | n/a | -unicameral- | 3/15 | 20.0 |
| VT | 10 | 10D, 0R | 10/30 | 51D, 15R, 2Ind | 68/150 | 78/180 | 43.3 |
| VA | 16 | 11D, 4R | 15/40 | 36D, 5R | 41/100 | 56/140 | 40.0 |
| WA | 7 | 18D, 3R | 21/49 | 34D, 11R | 45/98 | 66/147 | 44.9 |
| WV | 50 | 0D, 4R | 4/34 | 2D, 10R | 12/100 | 16/134 | 11.9 |
| WI* | 28 | 8D, 2R | 10/33 | 26D, 8R | 34/99 | 44/132 | 33.3 |
| WY | 41 | 0D, 7R | 7/31 | 3D, 14R | 17/62 | 24/93 | 25.8 |
* States share the same rank if their proportions of women legislators are exactly equal or round off to be equal (DE, SD; FL, RI; MA, NJ; NY, MT; KS, WI).
** Ind = other parties; in the Senate, 14 non-partisans; in the House, 3 non-partisans, 5 Independents.
Current Numbers:
Total Number of Women in D.C. and Territorial Legislatures
Count includes women legislators in U.S. Territories (American Samoa, Guam, Puerto Rico, the Virgin Islands, and the Northern Mariana Islands) and on the D.C. City Council.
PNP: Partido Nuevo Progresista
PPD: Partido Popular Democratico
Both the PNP and PPD parties are specific to Puerto Rico
Looking for information about former and current women serving in Territorial Legislatures?
Check out our full database, where you can find more detailed information on individuals and search by position, race/ethnicity, and party.
Trends Over Time
Despite gains in recent years, women have yet to reach gender parity at the state legislative level
Milestones
1894
The first three women elected to a state legislature in the country were Clara Cressingham (R), Carrie C. Holly (R), and Frances Klock (R), all in the Colorado House of Representatives.
1895
Clara Cressingham (R) became the first woman to fill a leadership position in a state legislature, serving as Secretary of the Colorado House Republican Caucus.
1896
Martha Hughes Cannon (D) was elected to the Utah State Senate, becoming the first woman state senator in the country.
1924
Cora Belle Reynolds Anderson (R) was elected to the Michigan State House of Representatives, the first Native American woman in a state legislature.
1928
With her appointment to the West Virginia State House of Representatives, Minnie Buckingham Harper (R) became the first Black woman in a state legislature.
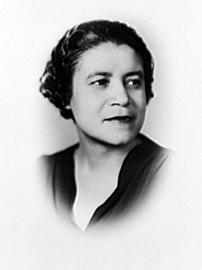
1930
Two Latinas, Fedelina Lucero Gallegos (R) and Porfirria Hidalgo Saiz (D), were elected to the New Mexico House of Representatives, the first Latina state legislators.
1933
Minnie Davenport Craig (NPL-ND) became the first woman to hold the position of speaker of the House in a state legislature. A member of the state Non-Partisan League party, she also served as a Republican National Committeewoman.
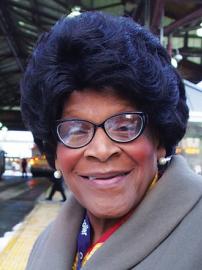
1938
Crystal Dreda Bird Fauset (D) was elected to the Pennsylvania State House of Representatives, the first Black woman elected to a state legislature.
1962
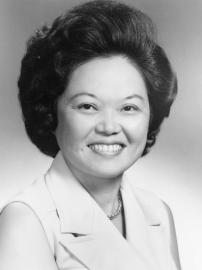
Patsy Takemoto Mink (D) became the first Asian American/Pacific Islander woman elected to a state legislature when she won a seat in the Hawaii Senate.
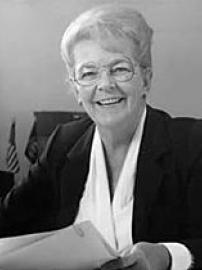
1974

Elaine Noble (D) became the first openly lesbian or gay candidate elected to a state legislature. She served in the Massachusetts House of Representatives for two terms starting in January 1975.
1983
Vesta Roy (R-NH) became the first woman to hold the position of president of a state senate.
1992
Althea Garrison (R) was elected to the Massachusetts House of Representatives, becoming the first transgender or transsexual person to serve in a state legislature in the United States. Garrison was outed against her wishes after being elected. Garrison came out publicly in an October 2023 media interview with The 19th.
1994
Olympia Snowe (R-ME) became the first woman (and the only Republican woman) to have been elected to her State House, State Senate, U.S. House, and U.S. Senate. Debbie Stabenow (D-MI) also followed this path to the U.S. Senate, making her the first Democrat to do so.
2007

Colleen Hanabusa (D) became president of the Hawaii Senate, the first woman of color and the first Asian American/Pacific Islander woman woman to hold the top leadership position in a state legislative chamber.
2008
Karen Bass (D) became speaker of the California State Assembly, the first woman of color to serve as speaker of a state house and the first Black woman to lead either house of a state legislature.
2009
The New Hampshire Senate became the first state legislative chamber in the country to reach or surpass gender parity, with 13 of its 24 seats (54%) held by women in 2009-2010.
2011

Margarita Prentice (D) becomes Senate president pro tempore of the Washington Senate, the first Latina to lead either chamber of a state legislature.
2013

Tina Kotek (D-OR) became the country's first openly lesbian state House speaker.
2017

Twenty-five years after Althea Garrison's election and non-consensual outing, Danica Roem (D-VA) became the first openly transgender person to be elected and to serve in a state legislature in the United States.
2019
Nevada became the first state to have women hold a majority of state legislative seats (32 of 63, or 50.8%). While women hold a majority of the seats overall, they are majority in only one chamber, the Assembly, where they hold 23 of the 42 seats. The New Hampshire Senate was the first state legislative chamber to surpass gender parity in 2009, although its overall proportion in both chambers still remained below 50%.
Percent of Party by State
Women as a Percentage of Democratic and Republican State Legislators
Data updates as of June 2026. Sources for party division by state: Ballotpedia, National Conference of State Legislatures. While Nebraska is a nonpartisan legislature, members' publicly shared party affiliation is included here.
Representativeness of Women State Legislators by Race/Ethnicity and State
Data updates as of June 2026.
The graphs below present the most current data on women state legislators by race and ethnicity in comparison to each state’s relative populations across racial and ethnic categorizations, according to the U.S. Census. Providing information on the representation of women across various racial/ethnic categories allows for a more detailed assessment of women’s political status in elected office.
Data provided by the Center for American Women and Politics and the United States Census Bureau: Annual Estimates of the Resident Population by Sex, Race, and Hispanic Origin: April 1, 2020, to July 1, 2024 (SC-EST2022-SR11H).