
All Congress
Current Numbers:
U.S. Delegate
U.S. Delegates are non-voting members and are not included in our total counts.
Looking for information about former and current women serving in Congress?
Check out our full database, where you can find more detailed information on individuals and search by position, race/ethnicity, and party.
Methodological Statement on Race and Ethnicity
Since our founding in 1971, a primary initiative of the Center for American Women and Politics (CAWP) has been our collection and public reporting of data on women officeholders and, more recently, candidates. This data has been imperative to revealing the underrepresentation of women across levels of elected office in the United States and motivating efforts to increase women’s political power. Consistent with these goals, CAWP began collecting data on women officeholders by race and ethnicity in 1997 to document the disparities in women’s representation by race and ethnicity, as well as make clearer the persistent underrepresentation of women within historically marginalized racial and ethnic groups. These motivations continue to guide CAWP’s data collection and public reporting.
CAWP’s data collection and public reporting has historically combined race and ethnicity based in our recognition that these identifications, as well as their influence on individual and group experiences, are not wholly separable and are rooted in complex social constructions. As our earliest coding aligned with the U.S. Census (see below), we approach our racial and ethnic identification measurement with the U.S. Census recognition that the categories we use “reflect a social definition of race recognized in this country and not an attempt to define race biologically, anthropologically, or genetically.” Ethnicity, when distinguished from race, often denotes shared culture, such as language, ancestry, practices, and beliefs. In a slight departure from the U.S. Census, to date we have not distinguished race from ethnicity in our reporting, as is most notable in our inclusion of Latina among all racial/ethnic categories. The U.S. Census has considered including Latino/a as a racial category. Likewise, they have considered but not adopted inclusion of Middle Eastern/North African among racial categories, which we now include in our data.
CAWP has reported summary data on women officeholders and candidates by race/ethnicity since 1997. Prior to 2021, we reported this data under the category of “women of color,” presenting aggregate counts of women with self-identified races and ethnicities other than white with sub-counts by each racial/ethnic group (including one group for any women who identified as multiracial). While this approach was consistent with CAWP’s interest in challenging the myth that women are not monolithic, it centered whiteness as a default racial/ethnic category.
In our current reporting, beginning in 2021, we provide more detailed counts of women by racial and ethnic groups, including white women. In our current pages for women officeholders by race and ethnicity, we also offer more detailed current and historic data on Asian American/Pacific Islander, Black, Latina, Middle Eastern/North African, and Native American/Alaska Native/Native Hawaiian, and white women officeholders. CAWP added Middle Eastern/North African as a category of self-identification starting in 2019. We also included Alaska Native as a category for self-identification for the first time in 2019 and Native Hawaiian as a category for self-identification for the first time in 2021, providing greater specificity for native peoples within the United States. While these racial and ethnic categories are themselves imperfect and subject to change, we adopt these categories provisionally and in alignment with both the U.S. Census and CAWP’s historical race and ethnicity data collection. We will periodically revisit these categories to reflect current understandings of racial and ethnic identification.
In our current reporting, women who self-identify as more than one race and ethnicity are included in each group with which they identify. If officeholders choose to identify as “multiracial” alone, without specifying any unique racial and ethnic identifications, they are categorized as such in CAWP’s database and reporting. We strongly caution against adding totals from each racial/ethnic group should, as it will double count officeholders. To conduct more detailed calculations, users should refer to CAWP’s Women Elected Officials Database. For those choosing to report an aggregate count of “women of color,” including any women with racial/ethnic identities other than white, please refer to the database search tool by race/ethnicity (and select all but white and unavailable) or contact CAWP staff directly.
Officeholder race/ethnicity is coded by a team of CAWP researchers in two ways. First, we rely on officeholder self-identification through direct contact (via email, phone, or social media). In direct exchanges with officeholders (whether at the candidate or officeholder stage), we provide them with information about why we collect this data, where it will be publicly reported, and how it will be used. We then provide a list of racial/ethnic categories, asking them to choose which (one or multiple) best reflect their racial/ethnic identification. Currently, we include the following racial/ethnic categories in our requests for self-identification: Asian or Pacific Islander, Black/African American, Hispanic/Latina, Middle Eastern/North African, Native American/Alaska Native, Native Hawaiian, white. We note that if none of these categories capture how an individual identifies that they should provide their preferred self-identification.
Where self-identification is not provided to us directly, we rely on historical and/or contemporary public records (e.g. websites, social media, interviews) that include statements of racial/ethnic self-identification by the officeholder. In a small number of cases where other indicators of racial/ethnic identification are publicly available, we use a multiple source verification process for coding. After exhausting these efforts, we label officeholders for whom we were unable to determine racial/ethnic identification as “unavailable.”
Looking for state-by-state information about women officeholders?
Check out our interactive map to find current and historical information on women officeholders.
All Congresswomen
Total Number of Women Who Have Served in Congress to Date
444
(293D, 150R, 1I)
3.5% of all members of Congress to date have been women.
- California has sent more women to Congress than any other state — a total of 51 to date.
- New York is next with 31 women to date.
19 (12D, 6R, 1I) women have served in both the U.S. Senate and U.S. House.
U.S. Senate
65
(39D, 25R, 1I)
U.S. House
398
(267D, 131R)
8 (4D, 4R) women have served as non-voting delegates and are not included in our totals.
Asian American/Pacific Islander Congresswomen
Total Number of Women Who Have Served in Congress to Date
16
(13D, 3R)
0.1% of all members of Congress to date have identified as Asian American/Pacific Islander women.
3.6% of all women who have served in Congress to date have identified as Asian American/Pacific Islander.
2 (2D) women have served in both the U.S. Senate and U.S. House.
U.S. Senate
3
(3D, 0R)
U.S. House
15
(12D, 3R)
2 (2R) women have served as non-voting delegates and are not included in our totals.
Black Congresswomen
Total Number of Women Who Have Served in Congress to Date
62
(61D, 1R)
0.5% of all members of Congress to date have identified as Black women.
14.0% of all women who have served in Congress to date have identified as Black.
1 (1D) woman has served in both the U.S. Senate and U.S. House.
U.S. Senate
5
(5D, 0R)
U.S. House
58
(57D, 1R)
3 (3D) women have served as non-voting delegates and are not included in our totals.
Latina Congresswomen
Total Number of Women Who Have Served in Congress to Date
34
(26D, 8R)
0.3% of all members of Congress to date have identified as Latina.
7.7% of all women who have served in Congress to date have identified as Latina.
U.S. Senate
1
(1D, 0R)
U.S. House
33
(25D, 8R)
1 (1R) woman has served as a non-voting delegate and is not included in our totals.
Middle Eastern/North African Congresswomen
Total Number of Women Who Have Served in Congress to Date
4
(4D, 0R)
0.03% of all members of Congress to date have identified as Middle Eastern/North African women.
0.9% of all women who have served in Congress to date have identified as Middle Eastern/North African.
U.S. Senate
0
(0D, 0R)
U.S. House
4
(4D, 0R)
Native American/Alaska Native/Native Hawaiian Congresswomen
Total Number of Women Who Have Served in Congress to Date
3
(3D, 0R)
0.02% of all members of Congress to date have identified as Native American/Alaska Native/Native Hawaiian women.
0.7% of all women who have served in Congress to date have identified as Native American/Alaska Native/Native Hawaiian.
U.S. Senate
0
(0D, 0R)
U.S. House
3
(3D, 0R)
White Congresswomen
Total Number of Women Who Have Served in Congress to Date
332
(190D, 141R, 1I)
2.6% of all members of Congress to date have identified as white women.
74.3% of all women who have served in Congress to date have identified as white.
17 (9D, 7R, 1I) women have served in both the U.S. Senate and U.S. House.
U.S. Senate
57
(32D, 24R, 1I)
U.S. House
290
(168D, 122R)
2 (1D, 1R) women have served as non-voting delegates and are not included in our totals.
Why do we collect data on women officeholders by race and ethnicity?
Since our founding in 1971, a primary initiative of the Center for American Women and Politics (CAWP) has been our collection and public reporting of data on women officeholders and, more recently, candidates. This data has been imperative to revealing the underrepresentation of women across levels of elected office in the United States and motivating efforts to increase women’s political power. Consistent with these goals, CAWP began collecting data on women officeholders by race and ethnicity in 1997 to document the disparities in women’s representation by race and ethnicity, as well as make clearer the persistent underrepresentation of women within historically marginalized racial and ethnic groups. These motivations continue to guide CAWP’s data collection and public reporting.
What do we mean by race and ethnicity?
CAWP’s data collection and public reporting has historically combined race and ethnicity based in our recognition that these identifications, as well as their influence on individual and group experiences, are not wholly separable and are rooted in complex social constructions. As our earliest coding aligned with the U.S. Census (see below), we approach our racial and ethnic identification measurement with the U.S. Census recognition that the categories we use “reflect a social definition of race recognized in this country and not an attempt to define race biologically, anthropologically, or genetically.” Ethnicity, when distinguished from race, often denotes shared culture, such as language, ancestry, practices, and beliefs. In a slight departure from the U.S. Census, to date we have not distinguished race from ethnicity in our reporting, as is most notable in our inclusion of Latina among all racial/ethnic categories. The U.S. Census has considered including Latino/a as a racial category. Likewise, they have considered but not adopted inclusion of Middle Eastern/North African among racial categories, which we now include in our data.
How do we report data by race and ethnicity? Has this changed over time?
CAWP has reported summary data on women officeholders and candidates by race/ethnicity since 1997. Prior to 2021, we reported this data under the category of “women of color,” presenting aggregate counts of women with self-identified races and ethnicities other than white with sub-counts by each racial/ethnic group (including one group for any women who identified as multiracial). While this approach was consistent with CAWP’s interest in challenging the myth that women are not monolithic, it centered whiteness as a default racial/ethnic category.
In our current reporting, beginning in 2021, we provide more detailed counts of women by racial and ethnic groups, including white women. In our current pages for women officeholders by race and ethnicity, we also offer more detailed current and historic data on Asian American/Pacific Islander, Black, Latina, Middle Eastern/North African, and Native American/Alaska Native/Native Hawaiian, and white women officeholders. CAWP added Middle Eastern/North African as a category of self-identification starting in 2019. We also included Alaska Native as a category for self-identification for the first time in 2019 and Native Hawaiian as a category for self-identification for the first time in 2021 providing greater specificity for native peoples within the United States. While these racial and ethnic categories are themselves imperfect and subject to change, we adopt these categories provisionally and in alignment with both the U.S. Census and CAWP’s historical race and ethnicity data collection. We will periodically revisit these categories to reflect current understandings of racial and ethnic identification.
In our current reporting, women who self-identify as more than one race and ethnicity are included in each group with which they identify. If officeholders choose to identify as “multiracial” alone, without specifying any unique racial and ethnic identifications, they are categorized as such in CAWP’s database and reporting. We strongly caution against adding totals from each racial/ethnic group should, as it will double count officeholders. To conduct more detailed calculations, users should refer to CAWP’s Women Elected Officials Database. For those choosing to report an aggregate count of “women of color,” including any women with racial/ethnic identities other than white, please refer to the database search tool by race/ethnicity (and select all but white and unavailable) or contact CAWP staff directly.
How do we collect racial/ethnic identification data?
Officeholder race/ethnicity is coded by a team of CAWP researchers in two ways. First, we rely on officeholder self-identification through direct contact (via email, phone, or social media). In direct exchanges with officeholders (whether at the candidate or officeholder stage), we provide them with information about why we collect this data, where it will be publicly reported, and how it will be used. We then provide a list of racial/ethnic categories, asking them to choose which (one or multiple) best reflect their racial/ethnic identification. Currently, we include the following racial/ethnic categories in our requests for self-identification: Asian or Pacific Islander, Black/African American, Hispanic/Latina, Middle Eastern/North African, Native American/Alaska Native, Native Hawaiian, White. We note that if none of these categories capture how an individual identifies that they should provide their preferred self-identification.
Where self-identification is not provided to us directly, we rely on historical and/or contemporary public records (e.g. websites, social media, interviews) that include statements of racial/ethnic self-identification by the officeholder. In a small number of cases where other indicators of racial/ethnic identification are publicly available, we use a multiple source verification process for coding. After exhausting these efforts, we label officeholders for whom we were unable to determine racial/ethnic identification as “unavailable.”
History of Women in the U.S. Congress
Please note: data for Congresses prior to the current one reflect the number of women serving at the conclusion of that Congress, including women who may have been sworn in after the election for the following Congress.
Footnotes
1A total of three (2D, 1R) women served in the Senate in the 75th Congress, but no more than two served together at any one time. Part of the time two Democrats served together, and part of the time one Democrat and one Republican served together.
2Does not include a Republican Delegate to the House from pre-statehood Hawaii.
3On election day in 1992, three women served in the Senate; two were elected and one was appointed. On November 3rd, Dianne Feinstein won a special election to complete two years of a term; she was sworn in on November 10, 1992. 4Does not include a Democratic Delegate to the House from Washington, DC.
4Does not include a Democratic Delegate to the House from Washington, DC. 5Includes Kay Bailey Hutchison (R-TX), who won a special election on June 5, 1993 to serve out the remaining year and one half of a term.
5Includes Kay Bailey Hutchison (R-TX), who won a special election on June 5, 1993 to serve out the remaining year and one half of a term.
6Includes Sheila Frahm (R-KS), who was appointed on June 11, 1996 to fill a vacancy caused by resignation. She was defeated in her primary race to complete the full term.
7Does not include two Democratic Delegates from the Virgin Islands and Washington, DC. Also does not include Susan Molinari (R-NY) who resigned 8/1/97. Includes 4 women (2 Democrats and 2 Republicans) who won special elections in March, April, and June 1998.
8Does not include two Democratic Delegates from the Virgin Islands and Washington, DC.
9House figure does not include two Democratic Delegates from the Virgin Islands and Washington, DC; Patsy Takemoto Mink (D-HI), who died on September 19, 2002. Senate figure does not include Jean Carnahan (D-MO) who stepped down on November 23, 2002. Does include Lisa Murkowski (R-AK), who was appointed to fill a Senate vacancy on December 20, 2002.
10Does not include three Democratic Delegates from Guam, the Virgin Islands and Washington, DC. Does include Stephanie Herseth (D-SD), who won a special election June 1, 2004 to fill a vacancy.
11Does not include three Democratic Delegates from Guam, the Virgin Islands and Washington, DC. Does include Juanita Millender-McDonald (D-CA), who died on April 22, 2007.
12Includes all current women House members; does not include three Democratic Delegates from Guam, the Virgin Islands and Washington, DC. Does not include Stephanie Tubbs Jones who passed away, but does include Marcia Fudge who won a special election to replace her.
13Kirsten Gillibrand (D-NY) moved from the House to the Senate when she was appointed on January 26, 2009 to fill a vacancy. Does not include Hillary Rodham Clinton, who was sworn in but resigned 1/16/09; Hilda Solis, who was sworn in but resigned on 2/17/09; and Ellen Tauscher, who resigned 6/26/09. Does include Judy Chu, who won a special election 7/14/09. Does not include three Democratic Delegates from Guam, the Virgin Islands and Washington, DC.
14Includes Kathy Hochul (D-NY) who won a special election. Does not include Jane Harman who resigned on 2/28/11; includes Janice Hahn (D-CA) who won a special election to replace her. Does not include Gabrielle Giffords who resigned on 1/24/12. Does include Suzanne Bonamici (D-OR) who won a special election. Does not include three Democratic Delegates from Guam, the Virgin Islands and Washington, DC.
15Does not include JoAnn Emerson (R-MO) who resigned on January 22, 2013. Includes Robin Kelly (D-IL) who won a special election. Includes Katherine Clark (D-MA) who won a special election 12/10/13 to fill a vacancy. Includes Alma Adams (D-NC) who won a special election 11/4/14. Does not include non-voting delegates.
16Includes Karen Handel (R-GA), who won a special election on June 20, 2017 to serve out the remaining year and one half of a term. Includes Tina Smith (D-MN) who was appointed to fill a vacancy on January 3, 2018. Includes Cindy Hyde-Smith (R-MS) who was appointed to fill a vacancy on April 9, 2018. Includes Debbie Lesko (R-AZ), who won a special election on April 25, 2018. Includes Brenda Jones (D-MI), Mary Gay Scanlon (D-PA), and Susan Wild (D-PA), who won a special elections on November 6, 2018. House numbers do not include Louise Slaughter (D-NY) who died on March 16, 2018. Does not include three Democratic Delegates from Guam, the Virgin Islands and Washington, DC and two Republican Delegates from American Samoa and Puerto Rico.
17Includes Kelly Loeffler (R-GA) who was appointed to fill a vacancy on 1/6/2020. Does not include Martha McSally (R-AZ) who was appointed to fill a vacancy on January 3rd, 2019 and left office on December 2nd 2020.
18Includes Colleen Hanabusa (D-HI) who won a special election to fill out an unexpired term in November 2016.
19Does not include Katie Hill (D-CA) who resigned on 11/1/2019. Does not include non-voting delegates.
20 Numbers do not include Kamala Harris (D-CA) who left office on 1/18/21 to become Vice President, Kelly Loeffler (R-GA) who left office on 1/20/21, Marcia Fudge who resigned on 3/10/21, Debra Haaland (D-NM) who left office on 3/16/21 to become U.S. Secretary of the Interior, Jackie Swihart Walorksi (R-IN) who died while in office on 8/3/22, or Karen Bass (CA) who resigned on 12/12/22 to become Mayor of Los Angeles. Includes Claudia Tenney (R-NY) who was certified as the winner of the general election but did not take office until 2/11/21 due to legal challenges; Julia Letlow (R-LA) who was sworn in on 4/14/21 after winning a special election to fill the vacancy left by the death of her husband who never officially took office; Melanie Stansbury (D-NM) who won a special election to succeed Debra Haaland, Shontel Brown (D-OH) who was sworn in on 11/4/21 after winning a special election, Sheila Cherfilus-McCormick (D-FL) who was sworn in on 1/18/2022 after winning a special election, Connie Conway (R-CA) who was sworn in on 6/15/22 after winning a special election, Mayra Flores (R-TX) who was sworn in on 6/21/22 after winning a special election, and Mary Peltola (D-AK) who was sworn in on 9/13/22 after winning a special election. Does not include non-voting delegates.
21Numbers include Jennifer McClellan (D-VA) who was sworn in on 3/7/23 after winning a special election, Laphonza Butler (D-CA) who was sworn in on 10/3/23 after being appointed to fill a vacancy, Celeste Maloy (R-UT) who was sworn in on 11/28/23 after winning a special election, LaMonica McIver (D-NJ) who was sworn in on 9/23/24 after winning a special election, and Erica Lee Carter (D-TX) who was sworn in on 11/12/23 after winning a special election. Numbers do not include Dianne Feinstein (D-CA) who died while in office on 9/29/23, Sheila Jackson Lee (D-TX) who died while in office on 7/19/24, or Laphonza Butler (D-CA) who resigned on 12/8/24. Does not include non-voting delegates.
22Numbers include Ashley Moody (R-FL) who was sworn in on 1/21/25 after being appointed to a vacancy, Adelita Grijalva (D-AZ) who was sworn in on 11/12/25 after winning a special election, Analilia Mejia (D-NJ) who was sworn in on 4/20/26 after winning a special election, and Darline Graham Nordone who was sworn in on 7/14/26 after being appointed to a vacancy. Numbers do not include Mikie Sherrill (D-NJ) who resigned on 11/20/25 to become Governor, Marjorie Taylor Greene (R-GA) who resigned on 1/5/26, or Sheila Cherfilus-McCormick (D-FL) who resigned on 4/21/26.
Trends Over Time
Despite gains in recent years, women have yet to reach gender parity at the congressional level
Milestones
1866
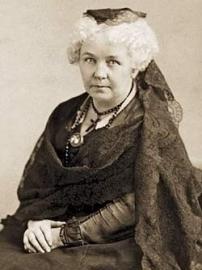
Elizabeth Cady Stanton was the first woman to run for the U.S. House of Representatives, even though she was not eligible to vote. She ran as an Independent from New York State, receiving 24 votes of 12,000 that were cast.
1916
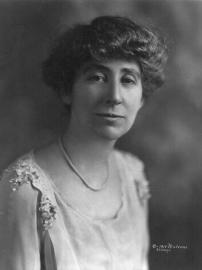
Jeannette Rankin, a Republican from Montana, became the first woman ever elected to Congress. She served in the U.S. House of Representatives from 1917 to 1919 and again from 1941 to 1942; a pacifist, she was the only lawmaker to vote against U.S. entry into both world wars.
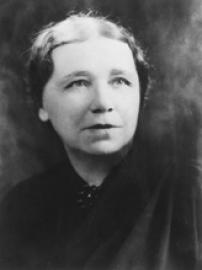
1922
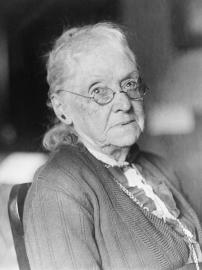
Rebecca Latimer Felton, a Georgia Democrat, became the first woman appointed to the Senate, but only served one day. While she was a suffragist, fully embracing equality of the sexes, she was also an outspoken white supremacist and advocate of segregation who spoke out in favor of lynching, as well as the last member of Congress to have been a slaveholder.
1925
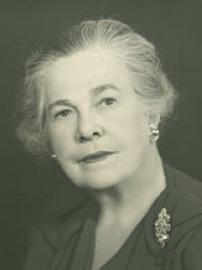
Representative Mae Ella Nolan (R-CA) became the first woman to chair a congressional committee when, during the 68th Congress, she chaired the Committee on Expenditures in the Post Office Department.
1932
Hattie Wyatt Caraway (D-AR), appointed in 1931 to fill a vacancy caused by her husband's death, ran for a full term and became the first woman elected to the Senate, where she served two full terms. She was the first woman to chair a Senate committee – the Committee on Enrolled Bills, a minor post.
1938
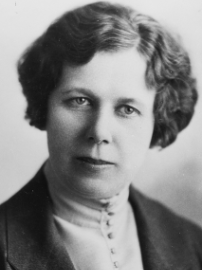
Gladys Pyle (R-SD) became the first Republican woman elected to the Senate and the first woman from either party to win election to the Senate without having first been appointed. Because she won a special election for a two-month term (November 1938 to January 1939), she worked in Washington on behalf of her constituents but was never officially sworn in.
1948
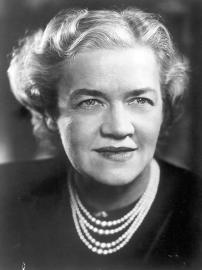
Margaret Chase Smith (R-ME) became the first woman elected to a full term in the U.S. Senate without having first been appointed to serve. Smith had first come to Congress when elected to fill her deceased husband's House seat; she went on to be elected to the Senate in her own right. With her election to the Senate, Smith also became the first woman to serve in both houses of Congress.
1949
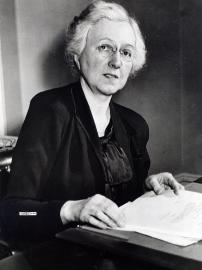
Representative Chase G. Woodhouse (D-CT) was the first woman to hold the position of secretary in the House Democratic Caucus.
1964
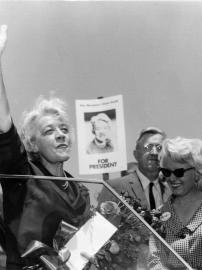
Senator Margaret Chase Smith, a Maine Republican, was nominated for the presidency by Vermont Senator George Aiken at the Republican national convention. Smith had campaigned briefly for the post, limiting herself to periods when the Senate was not in session. Elected to the House of Representatives in 1940 (to replace her dying husband) and the Senate in 1948, Smith had already made history by becoming the first woman to serve in both houses of Congress.
1965
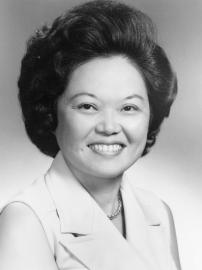
Patsy Takemoto Mink, a Democrat from Hawaii, became the first woman of color and the first woman of Asian American/Pacific Islander descent elected to the U.S. House of Representatives. She served until 1977 and was re-elected in 1990.
1967
Senator Margaret Chase Smith (R-ME) became the first woman to serve as the chair of the Senate Republican Conference.
1968
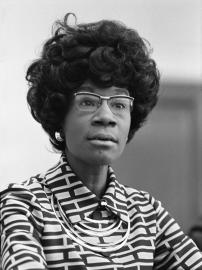
Shirley Chisholm, a New York Democrat, became the first Black woman to serve in Congress. She remained in the House of Representatives until 1982.
1973
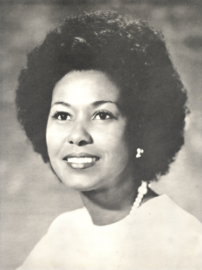
Yvonne Brathwaite Burke (D-CA) became the first woman to give birth while serving in Congress. Her daughter, Autumn Burke, went on to be elected to the California State Assembly in 2014.
1976

Mary Rose Oakar (D-OH) became the first Arab American woman elected to Congress.
1978
Nancy Landon Kassebaum (R-KS) was the first woman to have been elected to the Senate without having previously filled an unexpired Congressional term.
1985
With her appointment as U.S. ambassador to Ireland by President Ronald Reagan, Margaret Heckler (R) became the first woman to have served as a member of Congress, in a presidential cabinet, and as an ambassador. She represented Massachusetts in the U.S. House of Representatives from 1967 to 1983, served as secretary of Health and Human Services from 1983 to 1985, and was ambassador to Ireland from 1985 to 1989.

Congresswoman Lynn Morley Martin (R-IL) began her first of two terms as vice chair of the Republican Conference in the House, the first time a woman held an elected position in the congressional party caucus' hierarchy.
1986

Barbara Ann Mikulski, a Maryland Democrat, became the first Democratic woman elected to the Senate without previously filling an unexpired Congressional term.
1987
Rep. Mary Rose Oakar (D-OH) became the first woman to serve as vice chair of the House Democratic Caucus.
1989

Representative Barbara Kennelly (D-CT) became the first woman to hold the position of House Democratic chief deputy whip.
Ileana Ros-Lehtinen, a Florida Republican, became the first Hispanic woman and first Cuban American to be elected to Congress. She was elected to the U.S. House of Representatives in August 1989 in a special election.
1990

Apart from single-member House delegations, the first all-woman U.S. House delegation was from Hawaii. Representatives Patricia Saiki (R) and Patsy Mink (D) served from 1990 to 1991. They were also the first all-woman of color House delegation.
1992
Nydia Velázquez, a New York Democrat, became the first Puerto Rican woman elected to Congress.
Carol Moseley Braun, an Illinois Democrat, became the first Black woman and the first woman of color to be elected to the U.S. Senate. She had also been the first Black woman to win a major party Senate nomination. She defeated the incumbent in the primary and won the resulting open seat in the general election. Her term ended in 1999 when she lost her re-election bid.
1994
Olympia Snowe (R-ME) became the first woman (and the only Republican woman) to have been elected to her State House, State Senate, U.S. House, and U.S. Senate. Debbie Stabenow (D-MI) also followed this path to the U.S. Senate, making her the first Democrat to do so.
1995
Senator Barbara Mikulski (D-MD) became the first woman to hold the position of secretary to the Senate Democratic Conference in the 104th Congress (1995-1997).

Senator Nancy Landon Kassebaum (R-KS) became the first woman to chair a major Senate committee, the Committee on Labor and Human Resources.
1998
Heather Wilson (R-NM) became the first woman military veteran elected to Congress. She was a member of the U.S. Air Force.
Tammy Baldwin, a Democrat from Wisconsin, became the first openly gay or lesbian person elected to Congress as a non-incumbent. She was also Wisconsin's first woman in Congress. In 2012, she became the first openly gay or lesbian person elected to the U.S. Senate.
1999
Senator Olympia Snowe (R-ME) became the first woman to serve as secretary of the Senate Republican Conference.
Senator Barbara Mikulski (D-MD) became the first woman to serve as secretary of the Senate Democratic Conference.
2000
Hillary Rodham Clinton (D) became the only first lady ever elected to public office. She was elected to the U.S. Senate, winning an open seat in a general election. She was also the first woman elected to the Senate from New York.
2001
Senator Kay Bailey Hutchison (R-TX) became the first woman to serve as vice chair of the Senate Republican Conference.
Senator Patty Murray (D-WA) became the first woman to serve as chair of the Democratic Senatorial Campaign Committee.

Representative Nancy Pelosi (D-CA) was elected by her colleagues as House Democratic whip, at that time the highest-ranking woman in the history of the U.S. Congress.
2002

Representative Nancy Pelosi (D-CA) became the first woman to head her party in Congress when she was elected by her colleagues as House Democratic leader.
2005
Washington State became the first state to have both a woman governor (Christine Gregoire, D) and two women serving in the U.S. Senate (Patty Murray, D and Maria Cantwell, D). New Hampshire followed suit in 2013.
2007
Representative Nancy Pelosi (D-CA) became the first woman to serve as speaker of the U.S. House.
Three congresswomen became the first women of color to chair congressional committees: Representative Stephanie Tubbs Jones (D-OH), Committee on Ethics; Representative Juanita Millender-McDonald (D-CA), Committee on House Administration; and Representative Nydia Velázquez (D-NY), Committee on Small Business.
2012

Kyrsten Sinema (D-AZ) became the first openly bisexual person elected to Congress. In 2018, she became the first openly bisexual person elected to the U.S. Senate.
Mazie Hirono (D-HI) became the first Asian American/Pacific Islander woman — and only the second woman of color — elected to the U.S. Senate.
2013
New Hampshire became the first state to have an all-female Congressional delegation (Senators Jeanne Shaheen and Kelly Ayotte, and Representatives Ann McLane Kuster and Carol Shea-Porter.)
2015

Mia Love (R-UT) became the first Black Republican woman in Congress.
2016
Catherine Cortez Masto (D-NV) became the first Latina elected to the U.S. Senate.
Kamala Harris (D-CA), who is both Black and South Asian, became the first South Asian and second Black woman elected to the U.S. Senate.
2017
Senator Elizabeth Warren (D-MA) became the first woman to serve as vice chair of the Senate Democratic Conference.
2018
Sharice Davids (D-KS) and Deb Haaland (D-NM) became the first Native American women elected to Congress.
Ilhan Omar (D-MN) and Rashida Tlaib (D-MI) became the first Muslim women elected to Congress.
2024

Sarah McBride (D-DE) became the first out transgender person elected to Congress.
Leadership Roles and Committee Chairs
(Current and Past)
119th Congress 2025-2027
U.S. Senate Leadership Roles
U.S. Senate Committee Chairs
U.S. House Leadership Roles
U.S. House Committee Chairs
Widow Succession
Widows Who Succeeded Their Husbands in Congress
A total of 48 women have been elected or appointed to fill congressional vacancies created by the deaths of their husbands, 8 to the U.S. Senate and 40 to the U. S. House of Representatives.
U.S. Senate - 8*
Footnote
*Of the 8 women who took Senate seats after the death of their husbands, six were appointed to their deceased husband’s seats and one won a special election. In addition, Jean Carnahan was appointed to the Senate seat won posthumously by her husband.
U.S. House - 40**
Footnotes
**Of the 40 women who filled vacancies caused by the deaths of their husbands, 39 won special elections; the exception is Leonor Sullivan (see above). Also, Elizabeth Hawley Gasque (D-SC) was never sworn in or seated since Congress was not in session between her special election and the expiration of her term.
In addition to the 40 widows in the House, Debbie Dingell (D-MI, 2015 – present) succeeded her living husband after his retirement, the only woman to date to do so.
Sources: Women in the United States Congress, Congressional Research Service and the Center for American Women and Politics fact sheet, Women in the U.S. House of Representatives 2005.