All Statewide Elective Executive
Current Numbers
Total Number of Women in Statewide Elective Executive Office
Total count for women statewide elective executive officeholders does not include: officials in appointive state Cabinet-level positions; officials elected to executive posts by the legislature; officials elected as commissioners or board members from districts rather than statewide; members of the judicial branch; or elected members of university Boards of Trustees or Boards of Education.
This is not a record high for women serving in statewide elective executive office.
1.3% of all statewide elective executives identify as Asian American/Pacific Islander women.
4.1% of all women statewide elective executives identify as Asian American/Pacific Islander.
3.2% of all statewide elective executives identify as Black women.
10.3% of all women statewide elective executives identify as Black.
2.3% of all statewide elective executives identify as Latina.
7.2% of all women statewide elective executives identify as Latina.
0% of all statewide elective executives identify as Middle Eastern/North African women.
0% of all women statewide elective executives identify as Middle Eastern/North African.
0.3% of all statewide elective executives identify as Native American/Alaska Native/Native Hawaiian women.
1.0% of all women statewide elective executives identify as Native American/Alaska Native/Native Hawaiian.
24.2% of all statewide elective executives identify as white women.
77.3% of all women statewide elective executives identify as white.
Governor
This is not a record high.
In addition, two women serve as governor in the U.S. Territories: Lou Leon Guerrero in Guam and Jenniffer González-Colón in Puerto Rico.
In addition, Lou Leon Guerrero (D) serves as Governor in Guam.
In addition, Jenniffer González-Colón (R) serves as Governor in Puerto Rico.
Methodological Statement on Race and Ethnicity
Since our founding in 1971, a primary initiative of the Center for American Women and Politics (CAWP) has been our collection and public reporting of data on women officeholders and, more recently, candidates. This data has been imperative to revealing the underrepresentation of women across levels of elected office in the United States and motivating efforts to increase women’s political power. Consistent with these goals, CAWP began collecting data on women officeholders by race and ethnicity in 1997 to document the disparities in women’s representation by race and ethnicity, as well as make clearer the persistent underrepresentation of women within historically marginalized racial and ethnic groups. These motivations continue to guide CAWP’s data collection and public reporting.
CAWP’s data collection and public reporting has historically combined race and ethnicity based in our recognition that these identifications, as well as their influence on individual and group experiences, are not wholly separable and are rooted in complex social constructions. As our earliest coding aligned with the U.S. Census (see below), we approach our racial and ethnic identification measurement with the U.S. Census recognition that the categories we use “reflect a social definition of race recognized in this country and not an attempt to define race biologically, anthropologically, or genetically.” Ethnicity, when distinguished from race, often denotes shared culture, such as language, ancestry, practices, and beliefs. In a slight departure from the U.S. Census, to date we have not distinguished race from ethnicity in our reporting, as is most notable in our inclusion of Latina among all racial/ethnic categories. The U.S. Census has considered including Latino/a as a racial category. Likewise, they have considered but not adopted inclusion of Middle Eastern/North African among racial categories, which we now include in our data.
CAWP has reported summary data on women officeholders and candidates by race/ethnicity since 1997. Prior to 2021, we reported this data under the category of “women of color,” presenting aggregate counts of women with self-identified races and ethnicities other than white with sub-counts by each racial/ethnic group (including one group for any women who identified as multiracial). While this approach was consistent with CAWP’s interest in challenging the myth that women are not monolithic, it centered whiteness as a default racial/ethnic category.
In our current reporting, beginning in 2021, we provide more detailed counts of women by racial and ethnic groups, including white women. In our current pages for women officeholders by race and ethnicity, we also offer more detailed current and historic data on Asian American/Pacific Islander, Black, Latina, Middle Eastern/North African, and Native American/Alaska Native/Native Hawaiian, and white women officeholders. CAWP added Middle Eastern/North African as a category of self-identification starting in 2019. We also included Alaska Native as a category for self-identification for the first time in 2019 and Native Hawaiian as a category for self-identification for the first time in 2021, providing greater specificity for native peoples within the United States. While these racial and ethnic categories are themselves imperfect and subject to change, we adopt these categories provisionally and in alignment with both the U.S. Census and CAWP’s historical race and ethnicity data collection. We will periodically revisit these categories to reflect current understandings of racial and ethnic identification.
In our current reporting, women who self-identify as more than one race and ethnicity are included in each group with which they identify. If officeholders choose to identify as “multiracial” alone, without specifying any unique racial and ethnic identifications, they are categorized as such in CAWP’s database and reporting. We strongly caution against adding totals from each racial/ethnic group should, as it will double count officeholders. To conduct more detailed calculations, users should refer to CAWP’s Women Elected Officials Database. For those choosing to report an aggregate count of “women of color,” including any women with racial/ethnic identities other than white, please refer to the database search tool by race/ethnicity (and select all but white and unavailable) or contact CAWP staff directly.
Officeholder race/ethnicity is coded by a team of CAWP researchers in two ways. First, we rely on officeholder self-identification through direct contact (via email, phone, or social media). In direct exchanges with officeholders (whether at the candidate or officeholder stage), we provide them with information about why we collect this data, where it will be publicly reported, and how it will be used. We then provide a list of racial/ethnic categories, asking them to choose which (one or multiple) best reflect their racial/ethnic identification. Currently, we include the following racial/ethnic categories in our requests for self-identification: Asian or Pacific Islander, Black/African American, Hispanic/Latina, Middle Eastern/North African, Native American/Alaska Native, Native Hawaiian, white. We note that if none of these categories capture how an individual identifies that they should provide their preferred self-identification.
Where self-identification is not provided to us directly, we rely on historical and/or contemporary public records (e.g. websites, social media, interviews) that include statements of racial/ethnic self-identification by the officeholder. In a small number of cases where other indicators of racial/ethnic identification are publicly available, we use a multiple source verification process for coding. After exhausting these efforts, we label officeholders for whom we were unable to determine racial/ethnic identification as “unavailable.”
Looking for information about former and current women serving in Statewide Elective Executive Office?
Check out our full database, where you can find more detailed information on individuals and search by position, race/ethnicity, and party.
All Statewide Elective Executives
Total Number of Women Who Have Served in Statewide Elective Executive Office to Date
626
(324D, 282R, 16NP, 2I, 2 Third Party)
Party totals reflect the most recent party of an officeholder.
Asian American/Pacific Islander Statewide Elective Executives
Total Number of Women Who Have Served in Statewide Elective Executive Office to Date
12
(9D, 3R)
1.9% of all women statewide elective executives to date have identified as Asian American/Pacific Islander.
Black Statewide Elective Executives
Total Number of Women Who Have Served in Statewide Elective Executive Office to Date
26
(21D, 5R)
4.2% of all women statewide elective executives to date have identified as Black.
Latina Statewide Elective Executives
Total Number of Women Who Have Served in Statewide Elective Executive Office to Date
30
(23D, 6R, 1NP)
4.8% of all women statewide elective executives to date have identified as Latina.
Middle Eastern/North African Statewide Elective Executives
Total Number of Women Who Have Served in Statewide Elective Executive Office to Date
0
(0D, 0R)
Native American/Alaska Native/Native Hawaiian Statewide Elective Executives
Total Number of Women Who Have Served in Statewide Elective Executive Office to Date
4
(3D, 1R)
0.6% of all women statewide elective executives to date have identified as Native American/Alaska Native/Native Hawaiian.
White Statewide Elective Executives
Total Number of Women Who Have Served in Statewide Elective Executive Office to Date
555
(270D, 268R, 15NP, 1I, 2 Third Party)
88.8% of all women statewide elective executives to date have identified as white.
Why do we collect data on women officeholders by race and ethnicity?
Since our founding in 1971, a primary initiative of the Center for American Women and Politics (CAWP) has been our collection and public reporting of data on women officeholders and, more recently, candidates. This data has been imperative to revealing the underrepresentation of women across levels of elected office in the United States and motivating efforts to increase women’s political power. Consistent with these goals, CAWP began collecting data on women officeholders by race and ethnicity in 1997 to document the disparities in women’s representation by race and ethnicity, as well as make clearer the persistent underrepresentation of women within historically marginalized racial and ethnic groups. These motivations continue to guide CAWP’s data collection and public reporting.
What do we mean by race and ethnicity?
CAWP’s data collection and public reporting has historically combined race and ethnicity based in our recognition that these identifications, as well as their influence on individual and group experiences, are not wholly separable and are rooted in complex social constructions. As our earliest coding aligned with the U.S. Census (see below), we approach our racial and ethnic identification measurement with the U.S. Census recognition that the categories we use “reflect a social definition of race recognized in this country and not an attempt to define race biologically, anthropologically, or genetically.” Ethnicity, when distinguished from race, often denotes shared culture, such as language, ancestry, practices, and beliefs. In a slight departure from the U.S. Census, to date we have not distinguished race from ethnicity in our reporting, as is most notable in our inclusion of Latina among all racial/ethnic categories. The U.S. Census has considered including Latino/a as a racial category. Likewise, they have considered but not adopted inclusion of Middle Eastern/North African among racial categories, which we now include in our data.
How do we report data by race and ethnicity? Has this changed over time?
CAWP has reported summary data on women officeholders and candidates by race/ethnicity since 1997. Prior to 2021, we reported this data under the category of “women of color,” presenting aggregate counts of women with self-identified races and ethnicities other than white with sub-counts by each racial/ethnic group (including one group for any women who identified as multiracial). While this approach was consistent with CAWP’s interest in challenging the myth that women are not monolithic, it centered whiteness as a default racial/ethnic category.
In our current reporting, beginning in 2021, we provide more detailed counts of women by racial and ethnic groups, including white women. In our current pages for women officeholders by race and ethnicity, we also offer more detailed current and historic data on Asian American/Pacific Islander, Black, Latina, Middle Eastern/North African, and Native American/Alaska Native/Native Hawaiian, and white women officeholders. CAWP added Middle Eastern/North African as a category of self-identification starting in 2019. We also included Alaska Native as a category for self-identification for the first time in 2019 and Native Hawaiian as a category for self-identification for the first time in 2021 providing greater specificity for native peoples within the United States. While these racial and ethnic categories are themselves imperfect and subject to change, we adopt these categories provisionally and in alignment with both the U.S. Census and CAWP’s historical race and ethnicity data collection. We will periodically revisit these categories to reflect current understandings of racial and ethnic identification.
In our current reporting, women who self-identify as more than one race and ethnicity are included in each group with which they identify. If officeholders choose to identify as “multiracial” alone, without specifying any unique racial and ethnic identifications, they are categorized as such in CAWP’s database and reporting. We strongly caution against adding totals from each racial/ethnic group should, as it will double count officeholders. To conduct more detailed calculations, users should refer to CAWP’s Women Elected Officials Database. For those choosing to report an aggregate count of “women of color,” including any women with racial/ethnic identities other than white, please refer to the database search tool by race/ethnicity (and select all but white and unavailable) or contact CAWP staff directly.
How do we collect racial/ethnic identification data?
Officeholder race/ethnicity is coded by a team of CAWP researchers in two ways. First, we rely on officeholder self-identification through direct contact (via email, phone, or social media). In direct exchanges with officeholders (whether at the candidate or officeholder stage), we provide them with information about why we collect this data, where it will be publicly reported, and how it will be used. We then provide a list of racial/ethnic categories, asking them to choose which (one or multiple) best reflect their racial/ethnic identification. Currently, we include the following racial/ethnic categories in our requests for self-identification: Asian or Pacific Islander, Black/African American, Hispanic/Latina, Middle Eastern/North African, Native American/Alaska Native, Native Hawaiian, White. We note that if none of these categories capture how an individual identifies that they should provide their preferred self-identification.
Where self-identification is not provided to us directly, we rely on historical and/or contemporary public records (e.g. websites, social media, interviews) that include statements of racial/ethnic self-identification by the officeholder. In a small number of cases where other indicators of racial/ethnic identification are publicly available, we use a multiple source verification process for coding. After exhausting these efforts, we label officeholders for whom we were unable to determine racial/ethnic identification as “unavailable.”
Trends Over Time
Despite gains in recent years, women have yet to reach gender parity in any branch of government
Milestones
1892
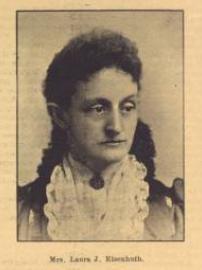
Laura Eisenhuth (D-ND) was elected superintendent of public instruction, the first woman elected to statewide executive office in any state.
1923
Soledad Chacon (D) was elected secretary of state in New Mexico, the first Latina and first woman of color to hold a statewide elected executive office.
1925
Nellie Tayloe Ross, a Wyoming Democrat, became the nation's first woman governor, elected to replace her deceased husband. She served for two years. Later, she became vice chair of the Democratic National Committee and director of the U.S. Mint. At the 1928 Democratic National Convention, she received 31 votes on the first ballot for vice president.
1955
Consuelo Bailey, a Vermont Republican, became the first woman ever elected lieutenant governor of a state. In that role, she served as president of the state Senate. Since she had previously served as speaker of the state House of Representatives, she thus became the only woman in the country ever to preside over both chambers of a state legislature.
1974
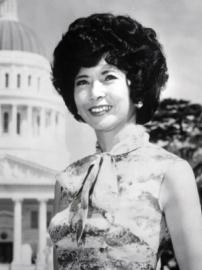
March Fong Eu (D) was elected California's secretary of state, the first Asian American/Pacific Islander to hold a statewide elected executive office.
1979
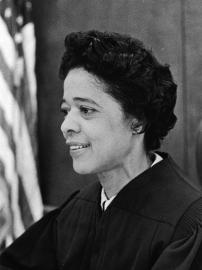
Velvalea "Vel" Phillips (D) was elected Wisconsin's secretary of state, the first Black woman to hold a statewide elected executive office.
1984
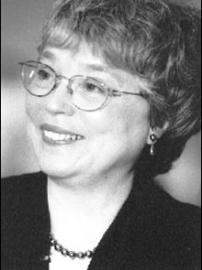
Arlene Violet (R-RI), a former nun, became the first woman elected as a state's attorney general, serving from 1985-87.
1985
Madeleine Kunin, a Democrat, was elected governor of Vermont. She became the first woman in any state to serve three terms as governor (1985-1991).
1987
Kay Orr, a Republican from Nebraska, was the first Republican woman elected governor of a state, as well as the first woman to defeat another woman in a gubernatorial race.
1990
Sandy Garrett (D) was elected Oklahoma's superintendent of public instruction, making her the first Native American woman to be elected to any statewide executive office in the U.S.
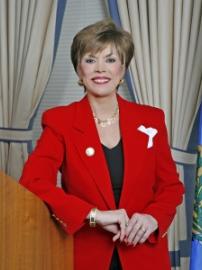
Joan Finney, a Kansas Democrat, became the first woman in any state to defeat an incumbent governor. She served as governor from 1991-1995.
2001
Christine Todd Whitman (R) of New Jersey becomes the first female former governor to serve in a presidential Cabinet-level position when she is appointed administrator of the Environmental Protection Agency by President George W. Bush. She had been the first woman elected governor of New Jersey and served two terms in that position.
2003
Kathleen Sebelius (D-KS) is the first woman governor whose father (John Gilligan, D-OH) was also governor of a state.
Arizona became the first state where a woman governor succeeded another woman governor. Jane Dee Hull (R) was succeeded by Janet Napolitano (D). Napolitano was also succeeded by a woman, Jan Brewer (R), in 2009.
2005
Washington State became the first state to have both a woman governor (Christine Gregoire, D) and two women serving in the U.S. Senate (Patty Murray, D and Maria Cantwell, D). New Hampshire followed suit in 2013.
2011
Two women of color, both Republicans elected in November 2010, took office as governors, the first women of color chief executives in the country. Susana Martinez, a Latina, became governor of New Mexico, and Nikki Haley, an Asian American, became governor of South Carolina.
2014
Maura Healey (D) was elected Massachusetts attorney general, becoming the first openly gay state attorney general elected in the United States as well as the first openly gay woman to be elected to any statewide office in the country.
2015
Kate Brown (D-OR) became the nation's first openly bisexual governor and the first person to be openly LGBT at the time of assuming the governor's office.
2018
Michele Lujan Grisham (NM) was elected governor of New Mexico, becoming the first Democratic woman of color governor nationwide.
State-by-State Information:
Governor
Permission to Reproduce CAWP Materials
Reproduction of information on the CAWP website for non-commercial purposes is encouraged, provided that clear and visible credit is given to Center for American Women and Politics, Eagleton Institute of Politics, Rutgers University. Any information reproduced must include footnotes/endnotes that apply to that information. Commercial reproduction requires prior permission in writing from the Center for American Women and Politics. All CAWP fact sheets are available on this web site and may be downloaded and copied as needed.
How to Cite Our Information
Center for American Women and Politics (CAWP). 2026. “Statewide Elective Executive.” New Brunswick, NJ: Center for American Women and Politics, Eagleton Institute of Politics, Rutgers University-New Brunswick. https://cawp.rutgers.edu/data/levels-office/statewide-elective-executive (Accessed January 14, 2026)
Governor
Current Numbers:
Governor
This is not a record high.
In addition, two women serve as governor in the U.S. Territories: Lou Leon Guerrero in Guam and Jenniffer González-Colón in Puerto Rico.
List of Governors
Kelly Ayotte
a New Hampshire Republican, was elected to an open seat in 2024. She served as a U.S. senator from 2011-2017 and attorney general of New Hampshire from 2004-2009.
Party: republican | STate: new hampshire
Maura Healey
a Massachusetts Democrat, was elected to an open seat in 2022. She served as Attorney General from 2015 until she became governor.
Party: democrat | STate: massachusetts
Katie Hobbs
an Arizona Democrat, was elected to an open seat in 2022. She served as secretary of state from 2019 until she became governor. She served in the Arizona Senate and House of Representatives.
Party: democrat | STate: arizona
Kathy Hochul
a New York Democrat, was lieutenant governor and became governor when the elected governor resigned. She served as U.S. representative from 2011-2013 and was elected lieutenant governor in 2014.
Party: democrat | STate: New york
Kay Ivey
an Alabama Republican, was lieutenant governor and became governor when the elected governor resigned. She was elected state treasurer in 2002 and re-elected in 2006; she won office as lieutenant governor in 2010 and was re-elected in 2014.
Party: republican | STate: alabama
Laura Kelly
a Kansas Democrat, was elected to an open seat in 2018. She served as a Kansas state senator from 2005 until she became governor.
Party: democrat | STate: kansas
Tina Kotek
an Oregon Democrat, was elected to an open seat in 2022. She served in the Oregon House of Representatives, becoming the speaker of the House.
Party: democrat | STate: oregon
Michelle Lujan Grisham
a New Mexico Democrat, was elected to an open seat in 2018. She served as U.S. representative from 2013 until she became governor. From 2004-2007 she was the New Mexico secretary of health.
Party: democrat | STate: new mexico
Janet Mills
a Maine Democrat, was elected to an open seat to become the state’s first woman governor in 2018. She served as attorney general of Maine from 2009 to 2011 and then 2013 until she became governor.
Party: democrat | STate: maine
Kim Reynolds
an Iowa Republican, was appointed governor in 2017 when the incumbent left office to serve as U.S. Ambassador to China. In 2018, she became the first woman elected as governor in Iowa. She served as lieutenant governor from 2011 until becoming governor. Prior to her election as lieutenant governor, she served in the Iowa State Senate and as Clarke County treasurer.
Party: republican | STate: iowa
Sarah Huckabee Sanders
an Arkansas Republican, won an open seat in 2022. Previously, she served in the Trump administration.
Party: republican | STate: Arkansas
Gretchen Whitmer
a Michigan Democrat, won an open seat in 2018. She served in the Michigan House of Representatives and Michigan State Senate, becoming senate minority leader.
Party: democrat | STate: michigan
Lou Leon Guerrero (D) serves as Governor in Guam.
In addition, Jenniffer González-Colón (R) serves as Governor in Puerto Rico.
List of Governors
Michelle Lujan Grisham
a New Mexico Democrat, was elected to an open seat in 2018. She served as U.S. representative from 2013 until she became governor. From 2004-2007 she was the New Mexico secretary of health.
Party: democrat | STate: new mexico
List of Governors
Kelly Ayotte
a New Hampshire Republican, was elected to an open seat in 2024. She served as a U.S. senator from 2011-2017 and attorney general of New Hampshire from 2004-2009.
Party: republican | STate: new hampshire
Maura Healey
a Massachusetts Democrat, was elected to an open seat in 2022. She served as Attorney General from 2015 until she became governor.
Party: democrat | STate: massachusetts
Katie Hobbs
an Arizona Democrat, was elected to an open seat in 2022. She served as secretary of state from 2019 until she became governor. She served in the Arizona Senate and House of Representatives.
Party: democrat | STate: arizona
Kathy Hochul
a New York Democrat, was lieutenant governor and became governor when the elected governor resigned. She served as U.S. representative from 2011-2013 and was elected lieutenant governor in 2014.
Party: democrat | STate: New york
Kay Ivey
an Alabama Republican, was lieutenant governor and became governor when the elected governor resigned. She was elected state treasurer in 2002 and re-elected in 2006; she won office as lieutenant governor in 2010 and was re-elected in 2014.
Party: republican | STate: alabama
Laura Kelly
a Kansas Democrat, was elected to an open seat in 2018. She served as a Kansas state senator from 2005 until she became governor.
Party: democrat | STate: kansas
Tina Kotek
an Oregon Democrat, was elected to an open seat in 2022. She served in the Oregon House of Representatives, becoming the speaker of the House.
Party: democrat | STate: oregon
Janet Mills
a Maine Democrat, was elected to an open seat to become the state’s first woman governor in 2018. She served as attorney general of Maine from 2009 to 2011 and then 2013 until she became governor.
Party: democrat | STate: maine
Kim Reynolds
an Iowa Republican, was appointed governor in 2017 when the incumbent left office to serve as U.S. Ambassador to China. In 2018, she became the first woman elected as governor in Iowa. She served as lieutenant governor from 2011 until becoming governor. Prior to her election as lieutenant governor, she served in the Iowa State Senate and as Clarke County treasurer.
Party: republican | STate: iowa
Sarah Huckabee Sanders
an Arkansas Republican, won an open seat in 2022. Previously, she served in the Trump administration.
Party: republican | STate: Arkansas
Gretchen Whitmer
a Michigan Democrat, won an open seat in 2018. She served in the Michigan House of Representatives and Michigan State Senate, becoming senate minority leader.
Party: democrat | STate: michigan
Methodological Statement on Race and Ethnicity
Since our founding in 1971, a primary initiative of the Center for American Women and Politics (CAWP) has been our collection and public reporting of data on women officeholders and, more recently, candidates. This data has been imperative to revealing the underrepresentation of women across levels of elected office in the United States and motivating efforts to increase women’s political power. Consistent with these goals, CAWP began collecting data on women officeholders by race and ethnicity in 1997 to document the disparities in women’s representation by race and ethnicity, as well as make clearer the persistent underrepresentation of women within historically marginalized racial and ethnic groups. These motivations continue to guide CAWP’s data collection and public reporting.
CAWP’s data collection and public reporting has historically combined race and ethnicity based in our recognition that these identifications, as well as their influence on individual and group experiences, are not wholly separable and are rooted in complex social constructions. As our earliest coding aligned with the U.S. Census (see below), we approach our racial and ethnic identification measurement with the U.S. Census recognition that the categories we use “reflect a social definition of race recognized in this country and not an attempt to define race biologically, anthropologically, or genetically.” Ethnicity, when distinguished from race, often denotes shared culture, such as language, ancestry, practices, and beliefs. In a slight departure from the U.S. Census, to date we have not distinguished race from ethnicity in our reporting, as is most notable in our inclusion of Latina among all racial/ethnic categories. The U.S. Census has considered including Latino/a as a racial category. Likewise, they have considered but not adopted inclusion of Middle Eastern/North African among racial categories, which we now include in our data.
CAWP has reported summary data on women officeholders and candidates by race/ethnicity since 1997. Prior to 2021, we reported this data under the category of “women of color,” presenting aggregate counts of women with self-identified races and ethnicities other than white with sub-counts by each racial/ethnic group (including one group for any women who identified as multiracial). While this approach was consistent with CAWP’s interest in challenging the myth that women are not monolithic, it centered whiteness as a default racial/ethnic category.
In our current reporting, beginning in 2021, we provide more detailed counts of women by racial and ethnic groups, including white women. In our current pages for women officeholders by race and ethnicity, we also offer more detailed current and historic data on Asian American/Pacific Islander, Black, Latina, Middle Eastern/North African, and Native American/Alaska Native/Native Hawaiian, and white women officeholders. CAWP added Middle Eastern/North African as a category of self-identification starting in 2019. We also included Alaska Native as a category for self-identification for the first time in 2019 and Native Hawaiian as a category for self-identification for the first time in 2021, providing greater specificity for native peoples within the United States. While these racial and ethnic categories are themselves imperfect and subject to change, we adopt these categories provisionally and in alignment with both the U.S. Census and CAWP’s historical race and ethnicity data collection. We will periodically revisit these categories to reflect current understandings of racial and ethnic identification.
In our current reporting, women who self-identify as more than one race and ethnicity are included in each group with which they identify. If officeholders choose to identify as “multiracial” alone, without specifying any unique racial and ethnic identifications, they are categorized as such in CAWP’s database and reporting. We strongly caution against adding totals from each racial/ethnic group should, as it will double count officeholders. To conduct more detailed calculations, users should refer to CAWP’s Women Elected Officials Database. For those choosing to report an aggregate count of “women of color,” including any women with racial/ethnic identities other than white, please refer to the database search tool by race/ethnicity (and select all but white and unavailable) or contact CAWP staff directly.
Officeholder race/ethnicity is coded by a team of CAWP researchers in two ways. First, we rely on officeholder self-identification through direct contact (via email, phone, or social media). In direct exchanges with officeholders (whether at the candidate or officeholder stage), we provide them with information about why we collect this data, where it will be publicly reported, and how it will be used. We then provide a list of racial/ethnic categories, asking them to choose which (one or multiple) best reflect their racial/ethnic identification. Currently, we include the following racial/ethnic categories in our requests for self-identification: Asian or Pacific Islander, Black/African American, Hispanic/Latina, Middle Eastern/North African, Native American/Alaska Native, Native Hawaiian, white. We note that if none of these categories capture how an individual identifies that they should provide their preferred self-identification.
Where self-identification is not provided to us directly, we rely on historical and/or contemporary public records (e.g. websites, social media, interviews) that include statements of racial/ethnic self-identification by the officeholder. In a small number of cases where other indicators of racial/ethnic identification are publicly available, we use a multiple source verification process for coding. After exhausting these efforts, we label officeholders for whom we were unable to determine racial/ethnic identification as “unavailable.”
Historic Numbers
women have served as governor in 32 states. In addition, three women have served as governor in Puerto Rico (one currently serving) and one currently serves as governor in Guam.
- Arizona is the first state where a woman succeeded another woman as governor, and the first state to have had five women governors.
- Of the 51 women governors, 35 were first elected in their own right; 3 replaced their husbands, and 13 became governor by constitutional succession, seven of whom subsequently won full terms.
- The record number of women serving simultaneously, achieved in 2025, is 14.
woman has served as governor in one state. In addition, woman currently serves as governor in Guam.
women have served as governor in zero states.
women have served as governor in one state. In addition, three women have served as governor in Puerto Rico (one currently serving).
women have served as governor in zero states.
women have served as governor in 30 states.
Methodological Statement on Race and Ethnicity
Since our founding in 1971, a primary initiative of the Center for American Women and Politics (CAWP) has been our collection and public reporting of data on women officeholders and, more recently, candidates. This data has been imperative to revealing the underrepresentation of women across levels of elected office in the United States and motivating efforts to increase women’s political power. Consistent with these goals, CAWP began collecting data on women officeholders by race and ethnicity in 1997 to document the disparities in women’s representation by race and ethnicity, as well as make clearer the persistent underrepresentation of women within historically marginalized racial and ethnic groups. These motivations continue to guide CAWP’s data collection and public reporting.
CAWP’s data collection and public reporting has historically combined race and ethnicity based in our recognition that these identifications, as well as their influence on individual and group experiences, are not wholly separable and are rooted in complex social constructions. As our earliest coding aligned with the U.S. Census (see below), we approach our racial and ethnic identification measurement with the U.S. Census recognition that the categories we use “reflect a social definition of race recognized in this country and not an attempt to define race biologically, anthropologically, or genetically.” Ethnicity, when distinguished from race, often denotes shared culture, such as language, ancestry, practices, and beliefs. In a slight departure from the U.S. Census, to date we have not distinguished race from ethnicity in our reporting, as is most notable in our inclusion of Latina among all racial/ethnic categories. The U.S. Census has considered including Latino/a as a racial category. Likewise, they have considered but not adopted inclusion of Middle Eastern/North African among racial categories, which we now include in our data.
CAWP has reported summary data on women officeholders and candidates by race/ethnicity since 1997. Prior to 2021, we reported this data under the category of “women of color,” presenting aggregate counts of women with self-identified races and ethnicities other than white with sub-counts by each racial/ethnic group (including one group for any women who identified as multiracial). While this approach was consistent with CAWP’s interest in challenging the myth that women are not monolithic, it centered whiteness as a default racial/ethnic category.
In our current reporting, beginning in 2021, we provide more detailed counts of women by racial and ethnic groups, including white women. In our current pages for women officeholders by race and ethnicity, we also offer more detailed current and historic data on Asian American/Pacific Islander, Black, Latina, Middle Eastern/North African, and Native American/Alaska Native/Native Hawaiian, and white women officeholders. CAWP added Middle Eastern/North African as a category of self-identification starting in 2019. We also included Alaska Native as a category for self-identification for the first time in 2019 and Native Hawaiian as a category for self-identification for the first time in 2021, providing greater specificity for native peoples within the United States. While these racial and ethnic categories are themselves imperfect and subject to change, we adopt these categories provisionally and in alignment with both the U.S. Census and CAWP’s historical race and ethnicity data collection. We will periodically revisit these categories to reflect current understandings of racial and ethnic identification.
In our current reporting, women who self-identify as more than one race and ethnicity are included in each group with which they identify. If officeholders choose to identify as “multiracial” alone, without specifying any unique racial and ethnic identifications, they are categorized as such in CAWP’s database and reporting. We strongly caution against adding totals from each racial/ethnic group should, as it will double count officeholders. To conduct more detailed calculations, users should refer to CAWP’s Women Elected Officials Database. For those choosing to report an aggregate count of “women of color,” including any women with racial/ethnic identities other than white, please refer to the database search tool by race/ethnicity (and select all but white and unavailable) or contact CAWP staff directly.
Officeholder race/ethnicity is coded by a team of CAWP researchers in two ways. First, we rely on officeholder self-identification through direct contact (via email, phone, or social media). In direct exchanges with officeholders (whether at the candidate or officeholder stage), we provide them with information about why we collect this data, where it will be publicly reported, and how it will be used. We then provide a list of racial/ethnic categories, asking them to choose which (one or multiple) best reflect their racial/ethnic identification. Currently, we include the following racial/ethnic categories in our requests for self-identification: Asian or Pacific Islander, Black/African American, Hispanic/Latina, Middle Eastern/North African, Native American/Alaska Native, Native Hawaiian, white. We note that if none of these categories capture how an individual identifies that they should provide their preferred self-identification.
Where self-identification is not provided to us directly, we rely on historical and/or contemporary public records (e.g. websites, social media, interviews) that include statements of racial/ethnic self-identification by the officeholder. In a small number of cases where other indicators of racial/ethnic identification are publicly available, we use a multiple source verification process for coding. After exhausting these efforts, we label officeholders for whom we were unable to determine racial/ethnic identification as “unavailable.”
State-by-State Information:
Governor
Permission to Reproduce CAWP Materials
Reproduction of information on the CAWP website for non-commercial purposes is encouraged, provided that clear and visible credit is given to Center for American Women and Politics, Eagleton Institute of Politics, Rutgers University. Any information reproduced must include footnotes/endnotes that apply to that information. Commercial reproduction requires prior permission in writing from the Center for American Women and Politics. All CAWP fact sheets are available on this web site and may be downloaded and copied as needed.
How to Cite Our Information
Center for American Women and Politics (CAWP). 2026. “Statewide Elective Executive.” New Brunswick, NJ: Center for American Women and Politics, Eagleton Institute of Politics, Rutgers University-New Brunswick. https://cawp.rutgers.edu/data/levels-office/statewide-elective-executive (Accessed January 14, 2026)
Other Statewide Elective Executive
Current Numbers:
Total Number of Women in Other Statewide Elective Executive Office
Total count for women statewide elective executive officeholders does not include: officials in appointive state Cabinet-level positions; officials elected to executive posts by the legislature; officials elected as commissioners or board members from districts rather than statewide; members of the judicial branch; or elected members of university Boards of Trustees or Boards of Education.
Methodological Statement on Race and Ethnicity
Since our founding in 1971, a primary initiative of the Center for American Women and Politics (CAWP) has been our collection and public reporting of data on women officeholders and, more recently, candidates. This data has been imperative to revealing the underrepresentation of women across levels of elected office in the United States and motivating efforts to increase women’s political power. Consistent with these goals, CAWP began collecting data on women officeholders by race and ethnicity in 1997 to document the disparities in women’s representation by race and ethnicity, as well as make clearer the persistent underrepresentation of women within historically marginalized racial and ethnic groups. These motivations continue to guide CAWP’s data collection and public reporting.
CAWP’s data collection and public reporting has historically combined race and ethnicity based in our recognition that these identifications, as well as their influence on individual and group experiences, are not wholly separable and are rooted in complex social constructions. As our earliest coding aligned with the U.S. Census (see below), we approach our racial and ethnic identification measurement with the U.S. Census recognition that the categories we use “reflect a social definition of race recognized in this country and not an attempt to define race biologically, anthropologically, or genetically.” Ethnicity, when distinguished from race, often denotes shared culture, such as language, ancestry, practices, and beliefs. In a slight departure from the U.S. Census, to date we have not distinguished race from ethnicity in our reporting, as is most notable in our inclusion of Latina among all racial/ethnic categories. The U.S. Census has considered including Latino/a as a racial category. Likewise, they have considered but not adopted inclusion of Middle Eastern/North African among racial categories, which we now include in our data.
CAWP has reported summary data on women officeholders and candidates by race/ethnicity since 1997. Prior to 2021, we reported this data under the category of “women of color,” presenting aggregate counts of women with self-identified races and ethnicities other than white with sub-counts by each racial/ethnic group (including one group for any women who identified as multiracial). While this approach was consistent with CAWP’s interest in challenging the myth that women are not monolithic, it centered whiteness as a default racial/ethnic category.
In our current reporting, beginning in 2021, we provide more detailed counts of women by racial and ethnic groups, including white women. In our current pages for women officeholders by race and ethnicity, we also offer more detailed current and historic data on Asian American/Pacific Islander, Black, Latina, Middle Eastern/North African, and Native American/Alaska Native/Native Hawaiian, and white women officeholders. CAWP added Middle Eastern/North African as a category of self-identification starting in 2019. We also included Alaska Native as a category for self-identification for the first time in 2019 and Native Hawaiian as a category for self-identification for the first time in 2021, providing greater specificity for native peoples within the United States. While these racial and ethnic categories are themselves imperfect and subject to change, we adopt these categories provisionally and in alignment with both the U.S. Census and CAWP’s historical race and ethnicity data collection. We will periodically revisit these categories to reflect current understandings of racial and ethnic identification.
In our current reporting, women who self-identify as more than one race and ethnicity are included in each group with which they identify. If officeholders choose to identify as “multiracial” alone, without specifying any unique racial and ethnic identifications, they are categorized as such in CAWP’s database and reporting. We strongly caution against adding totals from each racial/ethnic group should, as it will double count officeholders. To conduct more detailed calculations, users should refer to CAWP’s Women Elected Officials Database. For those choosing to report an aggregate count of “women of color,” including any women with racial/ethnic identities other than white, please refer to the database search tool by race/ethnicity (and select all but white and unavailable) or contact CAWP staff directly.
Officeholder race/ethnicity is coded by a team of CAWP researchers in two ways. First, we rely on officeholder self-identification through direct contact (via email, phone, or social media). In direct exchanges with officeholders (whether at the candidate or officeholder stage), we provide them with information about why we collect this data, where it will be publicly reported, and how it will be used. We then provide a list of racial/ethnic categories, asking them to choose which (one or multiple) best reflect their racial/ethnic identification. Currently, we include the following racial/ethnic categories in our requests for self-identification: Asian or Pacific Islander, Black/African American, Hispanic/Latina, Middle Eastern/North African, Native American/Alaska Native, Native Hawaiian, white. We note that if none of these categories capture how an individual identifies that they should provide their preferred self-identification.
Where self-identification is not provided to us directly, we rely on historical and/or contemporary public records (e.g. websites, social media, interviews) that include statements of racial/ethnic self-identification by the officeholder. In a small number of cases where other indicators of racial/ethnic identification are publicly available, we use a multiple source verification process for coding. After exhausting these efforts, we label officeholders for whom we were unable to determine racial/ethnic identification as “unavailable.”
Permission to Reproduce CAWP Materials
Reproduction of information on the CAWP website for non-commercial purposes is encouraged, provided that clear and visible credit is given to Center for American Women and Politics, Eagleton Institute of Politics, Rutgers University. Any information reproduced must include footnotes/endnotes that apply to that information. Commercial reproduction requires prior permission in writing from the Center for American Women and Politics. All CAWP fact sheets are available on this web site and may be downloaded and copied as needed.
How to Cite Our Information
Center for American Women and Politics (CAWP). 2026. “Statewide Elective Executive.” New Brunswick, NJ: Center for American Women and Politics, Eagleton Institute of Politics, Rutgers University-New Brunswick. https://cawp.rutgers.edu/data/levels-office/statewide-elective-executive (Accessed January 14, 2026)