Women Candidates in Election 2018: 5 Key Data Points Midway Through the Primaries
In order to tell an accurate story of women’s political outcomes in November, it’s essential that we demonstrate the empirical nuances and complexities of women’s candidacies before then. Therefore, at this midway point in the primary season whereby 26 states have held primary election contests, the Center for American Women and Politics (CAWP) at Rutgers University has analyzed the success of and prospects for women candidates for congressional and statewide executive offices.
Below are five key data points by which we can evaluate how women are faring with necessary attention to historical precedent, partisan differences, racial and ethnic diversity, and general election competitiveness.
For regularly updated data on women’s candidacies and historical information on women running for office, see CAWP’s Election Watch. In addition, follow Gender Watch 2018, a project of CAWP and the Barbara Lee Family Foundation, for real-time analyses of gender dynamics in election 2018.
1. Record levels of women are running for Congress and governor.
The numbers of women who have filed as candidates for the U.S. House, U.S. Senate, and governor have each surpassed previous highs.
- U.S. House: As of June 18th, 468 women have filed as candidates for the U.S. House, up from a previous record of 298 women candidates set in 2016. While Democratic women candidates for the U.S. House have surpassed their previous high of 190 (set in 2012) to 350 today, Republican women candidates for the U.S. House are just short of their record of 128 (set in 2010); as of June 18th, 118 Republican women have filed for candidacy for the House.
- U.S. Senate: As of June 18th, 51 (29D, 22R) women have filed as candidates for the U.S. Senate, up from a previous record of 40 women candidates set in 2016. Both Democratic and Republican women have already surpassed previous highs for Senate candidacies; the previous high was 28 (set in 2016) for Democrats and 17 (set in 2010) for Republicans.
- Governor: As of June 18th, 61 (40D, 21R) women have filed as candidates for governor, up from a previous record of 34 women candidates set in 1994.
With nominations decided in about half of all states, we have not yet surpassed record numbers of nominations for women candidates at any level of office. Follow CAWP’s candidate summary to track nomination records broken in 2018.
2. But women are still one-quarter or less of all congressional and statewide executive candidates in 2018.
Women are 25.4% of all statewide executive candidates (including governor) who have already competed for major party nominations in election 2018; they are 30.7% of Democratic and 19.9% of Republican candidates that have competed in all states where primary elections or conventions for statewide executive offices have been held.
Among only candidates for governor, women are 23.3% of those candidates who have already competed for major party nominations in election 2018; they are 25.3% of Democratic and 20.9% of Republican candidates that have competed in all states where primary elections or conventions for governor have been held.
Women are 16.7% of U.S. Senate candidates who have already competed for major party nominations in election 2018; they are 24.4% of Democratic and 11.8% of Republican candidates that have competed in all 26 primary states and in Utah’s party conventions.
Women are 22.7% of all filed U.S. House candidates for major party nominations in states where nominations have already occurred; they are 31.2% of Democratic and 12.2% of Republican candidates for nomination in all 26 primary states and in Utah’s party conventions.[1]
With just 4 states left to certify primary candidates, women are 23.9% of all major party filed U.S. House candidates in election 2018. In the same states in 2016, women were 18.1% of all major party candidates on primary ballots. In 2018, women are 32.8% of all Democratic and 13.8% of all Republican U.S. House candidates certified thus far; in the same states in 2016, women were 25.6% of all Democratic and 11.8% of all Republican U.S. House candidates on primary ballots.
3. Women are winning primary nominations at high rates among Democrats, but not higher than previous cycles.
There are many ways to evaluate women candidates’ success in this year’s primary elections, which means that various numbers have been circulating from different organizations and media outlets. Below, we have broken down candidate outcomes by level of office, party, and incumbency and then compared current win rates for women with success rates in previous election cycles.
Importantly, the previous election data encompasses all primaries while the 2018 data includes just those states that have already selected nominees via primary elections or conventions. We have excluded California from the U.S. House totals because there remain multiple undecided contests.[2]
U.S. House
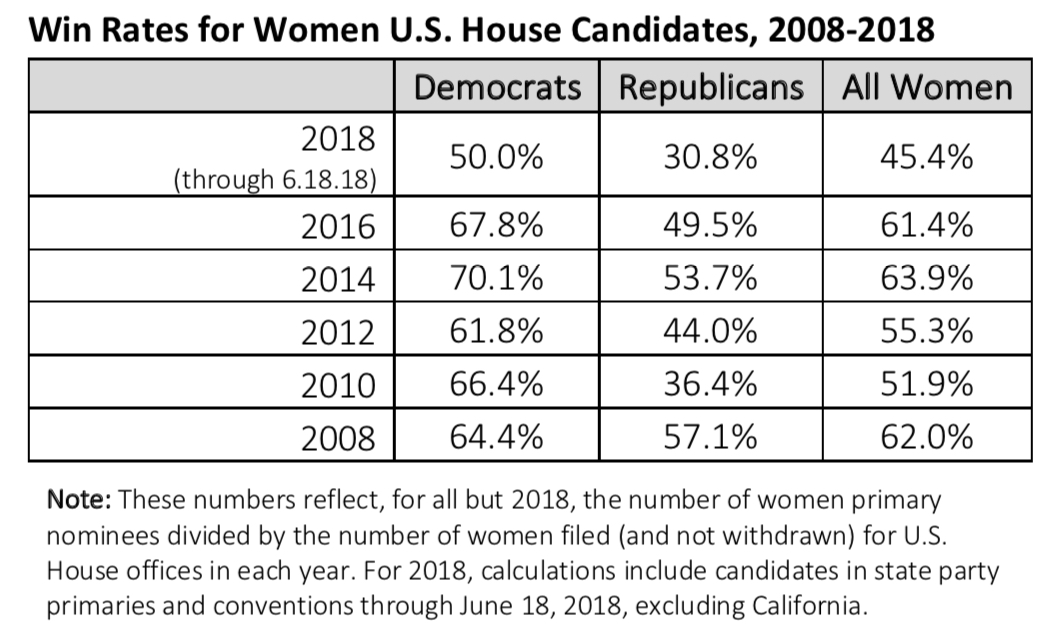
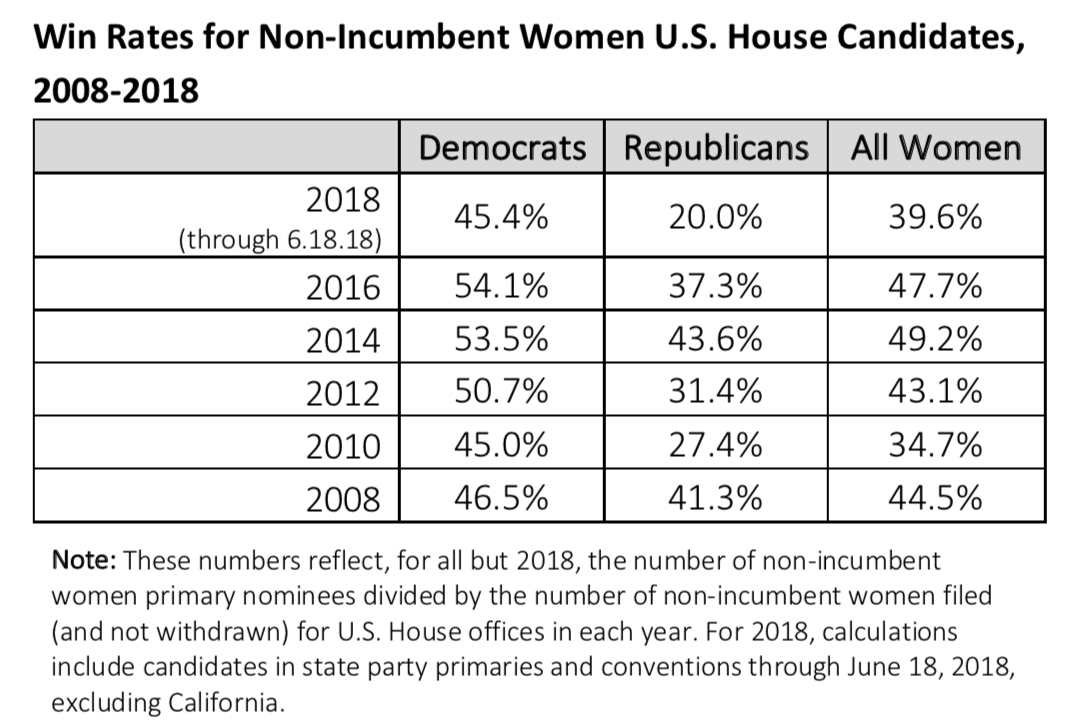
The win rates for women candidates in 2018 U.S. House primaries (excluding California) – overall and among non-incumbents only- is higher than men among Democrats, but not among Republicans. Still, women are just one-quarter of U.S. House nominees selected thus far in 2018. There are significant partisan differences in the pool of nominees; 41.5% of Democratic nominees and 8.2% of Republican nominees are women. Among only non-incumbent nominees, women are 49.3% of Democrats and 10.7% of Republicans. Moreover, Democratic women non-incumbents have won at a rate distinctly higher than their male and Republican female counterparts. Their success is not, however, unmatched historically; in previous election cycles, non-incumbent Democratic women House candidates have won at higher rates across all nominating contests.
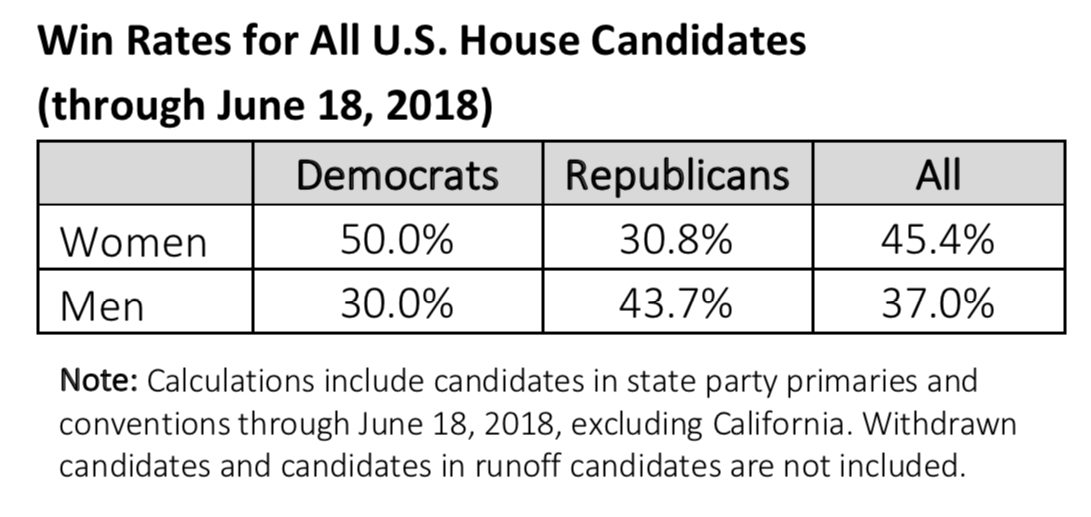
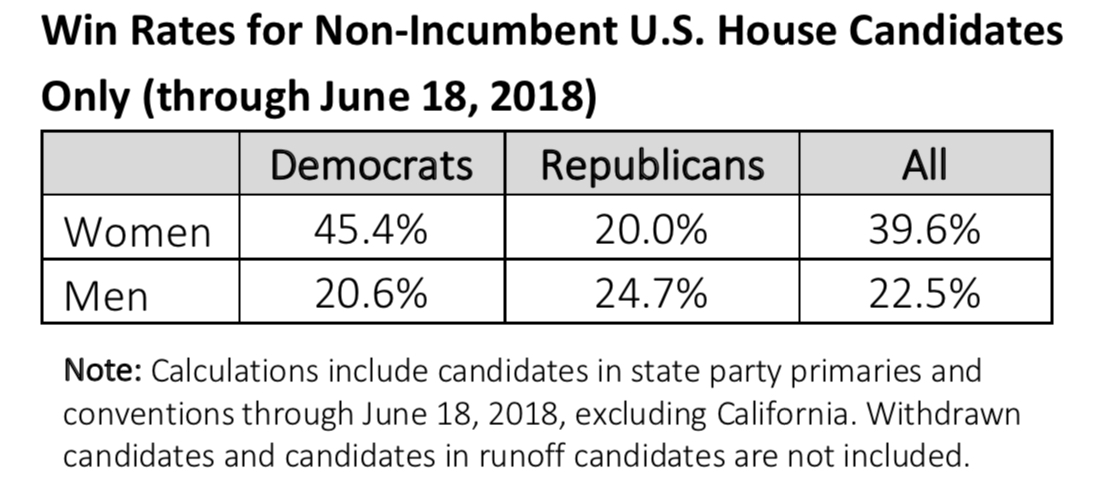
The win rates of women candidates – Democrats, Republicans, or overall - have not surpassed previous levels of success for women running for the U.S. House. Importantly, as more women run – especially as non-incumbents and within the same primary contests, the number and proportion of women losing is likely to increase.
U.S. Senate
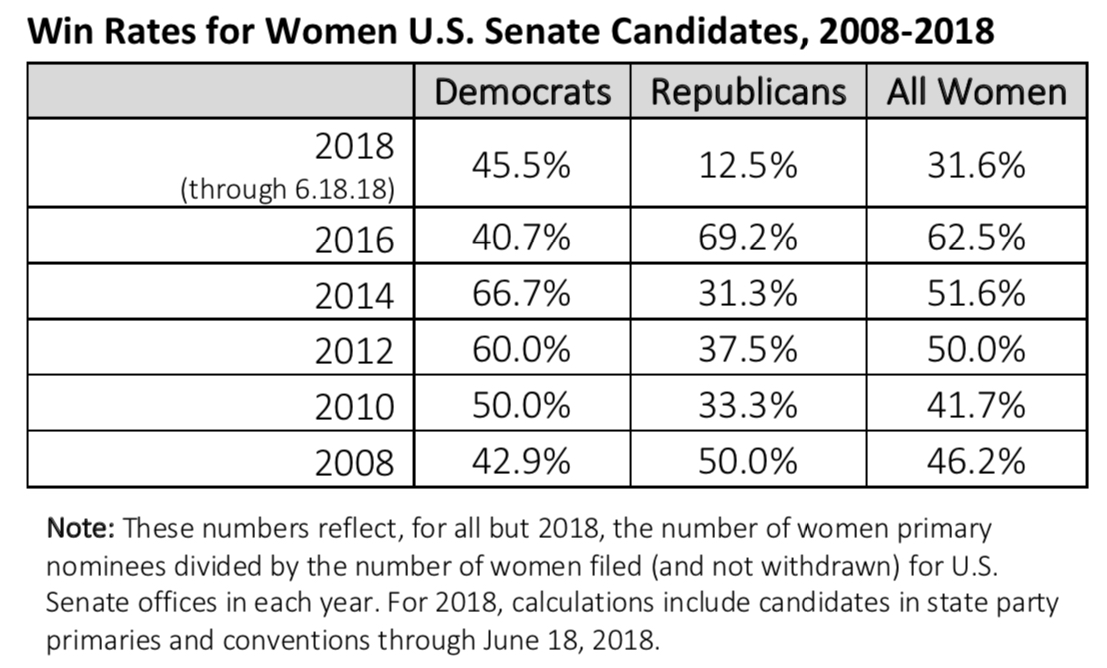
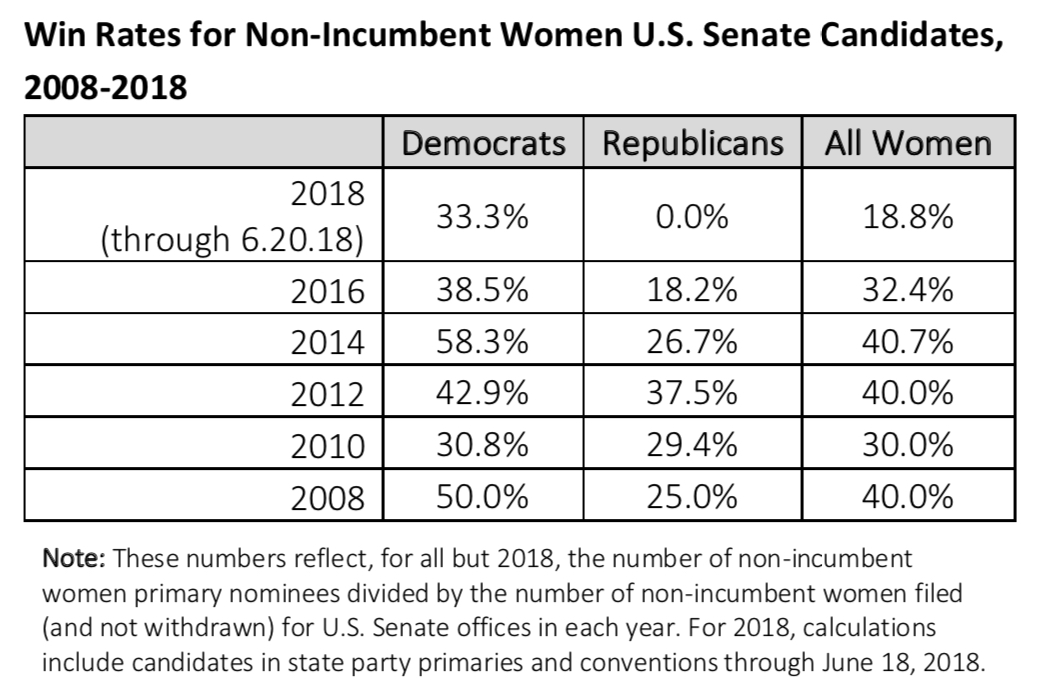
The win rates for women candidates in 2018 U.S. Senate primaries – overall and among non-incumbents only- is higher than men among Democrats, but not among Republicans. Still, women are just one-fifth of U.S. Senate nominees -31.3% of Democratic nominees and 7.7% of Republican nominees - selected thus far in 2018. Among non-incumbent nominees, however, women are 50% of Democrats and 0% of Republicans.
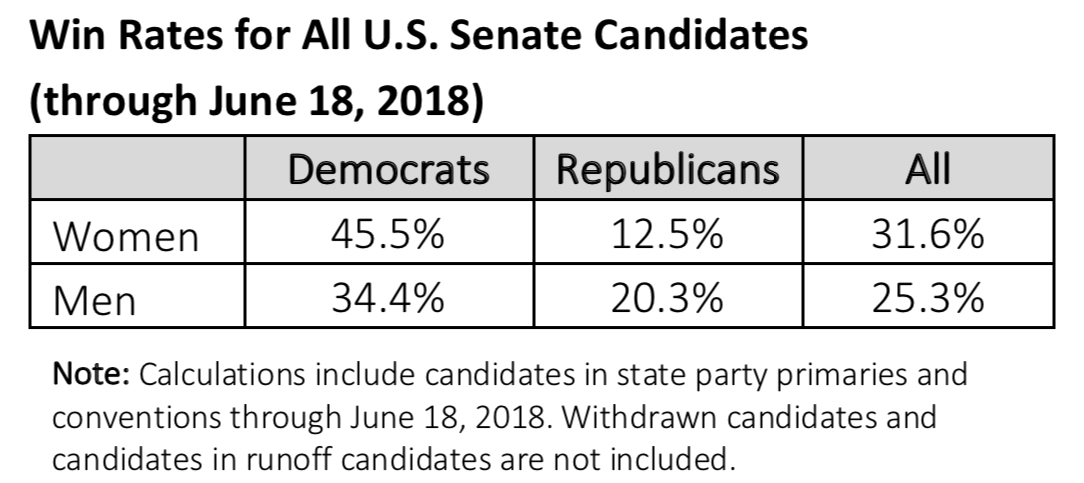
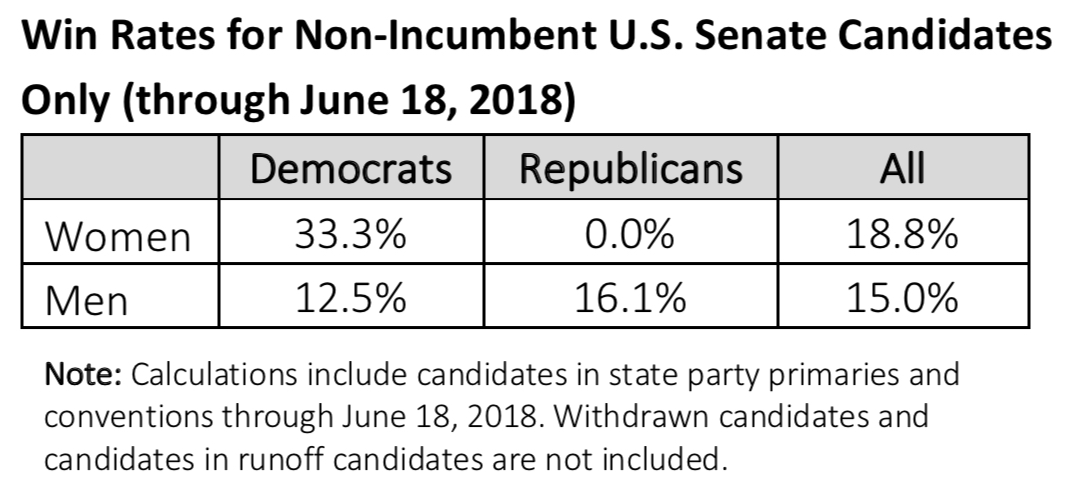
The win rates of women candidates – Democrats, Republicans, or overall – have not surpassed previous levels of success for women running for the U.S. Senate. Importantly, as more women run – especially as non-incumbents and within the same primary contests, the number and proportion of women losing is likely to increase.
Governor
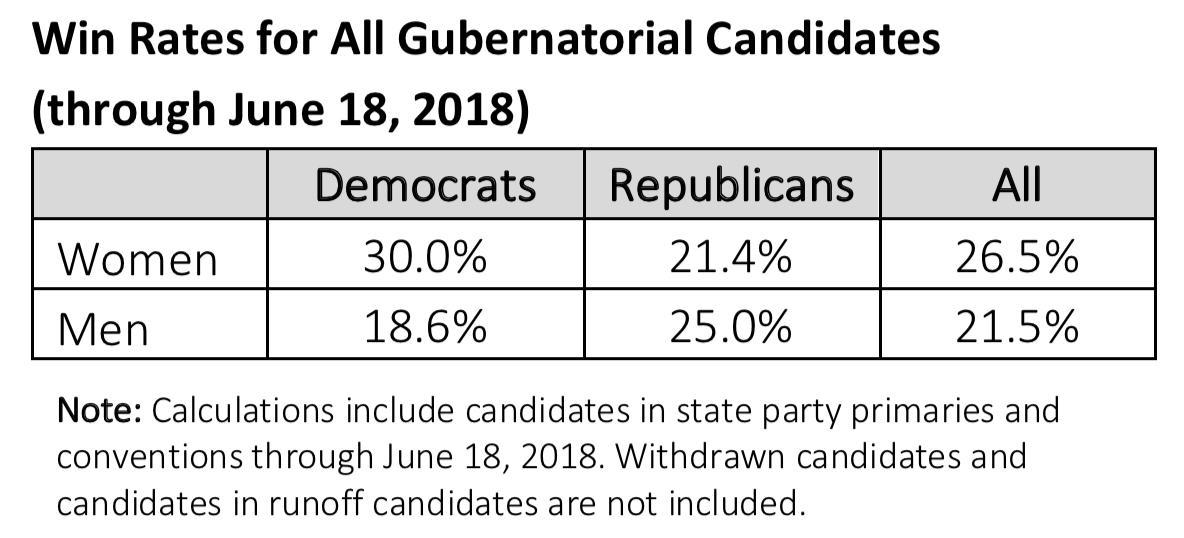
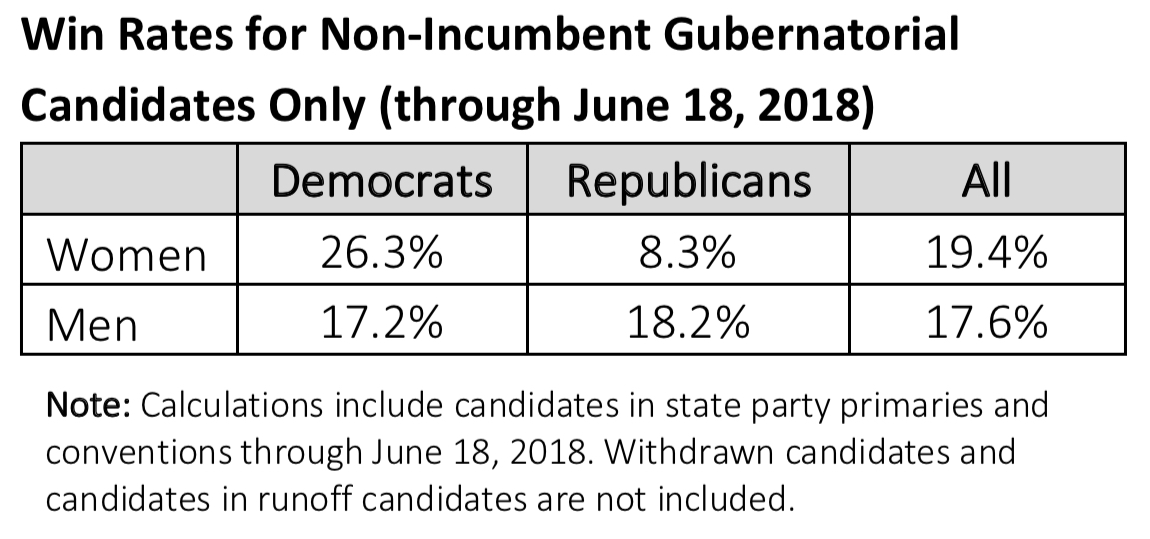
The win rates for women candidates in 2018 gubernatorial primaries – overall and among non-incumbents only- is higher than men among Democrats, but not among Republicans. Still, women are just over one-quarter (28.1%) of all gubernatorial nominees selected thus far in 2018. There are significant partisan differences in the pool of nominees; 35.3% of Democratic nominees and 20% of Republican nominees are women. Among only non-incumbent nominees, women are 33.3% of Democrats and 11.1% of Republicans.
Moreover, Democratic women non-incumbents have won at a higher rate than their male and Republican female counterparts.
4. Increasing women’s representation in November is more complicated than securing nominations. Women will start from a deficit in U.S. House and gubernatorial seats, and many women nominees are running in states and districts that favor their opponents.
With 13 women incumbents not returning to the U.S. House, making gains in women’s congressional representation requires first replacing those lost seats. In addition, several incumbent congresswomen are in danger of being defeated.
- Republican Representative Barbara Comstock (VA-10) is in a contest currently rated as leaning Democrat; because her opponent is a woman, however, the seat will continue to be woman-held. Republican Representative Claudia Tenney (NY-22) is running in a district deemed a toss-up by Cook Political Report. Republican Representative Martha Roby (AL-02) is running in a safely Republican district, but was forced into a runoff to secure her party’s nomination for re-election.
- Among the incumbent women senators running for re-election this year, two Democrats are in contests currently deemed as toss-ups by Cook Political Report: Senators Claire McCaskill (MO) and Heidi Heitkamp (ND).
Of the 99 women who have secured major party nominations for the U.S. House (excluding California): 32 (23D, 9R) are running in districts that favor their party; 63 (57D, 6R) are running in districts that favor their opponents; and 4 (3D, 1R) are running in districts that are deemed toss-ups by Cook Political Report.
Among non-incumbent House nominees only, 57 of 69 (82.6%) Democratic women and 6 of 9 (66.7%) Republican women are running in districts that favor their opponents. In contrast, of the 12 non-incumbent women who are nominees in districts that favor their party, 9 (75%) are Democrats and 3 (25%) are Republicans.
Of the 6 women who have secured major party nominations for the U.S. Senate: 2 (1D, 1R) are running in districts that favor their party; 2 (2D) are running in districts that favor their opponents; and 2 (2D) are running in districts that are deemed toss-ups by Cook Political Report. Just one non-incumbent woman nominee for the U.S. Senate thus far is in a race deemed competitive for her; in Nevada, Jacky Rosen (D) is the nominee in a toss-up Senate contest.
Of the 9 women who have secured major party nominations for governor: 5 (2D, 3R) are running in contests that favor their party; 3 (3D) are running in contests that favor their opponents; and 1 (1D) is running in a contest that is deemed a toss-up by Cook Political Report.
5. The representation of women of color varies by level of office and stage of the electoral process (candidacy and nomination). While women of color are the majority of Democratic women nominees for governor thus far, there are no women of color nominees for the U.S. Senate to date. Women of color are about one-third of candidates and nominees for the U.S. House.
U.S. House
- Of the 468 women who filed as candidates for the U.S. House as of June 18th, 164 (35%) identify as women of color (129 are Democrats and 35 are Republicans): 72 identify as Black; 48 identify as Latina; 31 identify as Asian/Pacific Islander; 2 identify as Native American; and 11 identify as multiracial.[3]
- Of the 99 women who have secured major party nominations for the U.S. House already (excluding California), 31 (31.3%) are women of color (27 are Democrats and 4 are Republicans): 19 identify as Black; 6 identify as Latina; 3 identify as Asian/Pacific Islander; 1 identifies as Native American; and 2 identify as multiracial.
- 3 women of color nominees – all Democrats – are nominees in districts that favor their party, including the potential first Latinas to represent Texas in Congress (Sylvia Garcia and Veronica Escobar) and the potential first Native American woman in Congress (Debra Haaland-NM).
- 43% of women of color major party candidates – compared to 45.4% of all women- have secured nominations in the states where primaries or conventions have already been held (excluding California). 34.9% of non-incumbent women of color candidates – compared to 39.6% of all women - for the U.S. House have been successful thus far.
U.S. Senate
- Of the 51 women who filed as candidates for the U.S. Senate as of June 18th, 11 (21.5%) identify as women of color (8 are Democrats and 3 are Republicans): 7 identify as Black; 1 identifies as Latina; 2 identify as Asian/Pacific Islander; and 1 identifies as multiracial.[6]
- Of the 6 women who have already secured major party nominations for the U.S. Senate, none are women of color.
Governor
- Of the 61 women who filed as candidates for governor as of June 18th, 14 (23%) identify as women of color: 5 identify as Black; 3 identify as Latina; 4 identify as Asian/Pacific Islander; 1 identifies as Native American; and 1 identifies as multiracial. [5]
- Of the 9 women who have already secured major party nominations for governor, 4 (44.4%) are women of color (all Democrats). More specifically, of the 6 women Democratic nominees, 4 are women of color. If successful, Stacey Abrams (D-GA) would be the first Black woman governor in the U.S. If successful, Lupe Valdez (D-TX) and/or Michelle Lujan Grisham (D-NM) would be the first Democratic Latina woman/en governor(s) in the U.S. Finally, Paulette Jordan (D-ID) is the first Native American woman nominee for governor in the U.S. and would also become the first Native American woman governor if successful this fall.
Looking Ahead
With 24 states left to select nominees, CAWP will be tracking women’s candidacies in real time at Election Watch and will offer insights into and analysis of gender dynamics in this year’s campaigns at Gender Watch 2018. Stay tuned.
[1] These data include withdrawn candidates in OH and CA who withdrew before the primary election but still appeared on the ballot.
[2] Real-time updates on CAWP’s Election Watch page include partial results from California, while we have excluded them here. This explains any discrepancy between numbers.
[3] Of the 468 women candidate who have filed for the U.S. House, racial identification remains unverified by CAWP for 25.
[4] Of the 51 women candidate who have filed for the U.S. Senate, racial identification remains unverified by CAWP for 3.
[5] Of the 61 women candidate who have filed for governor, racial identification remains unverified by CAWP for 2.


