The Representation of Women of Color among 2018 Candidates
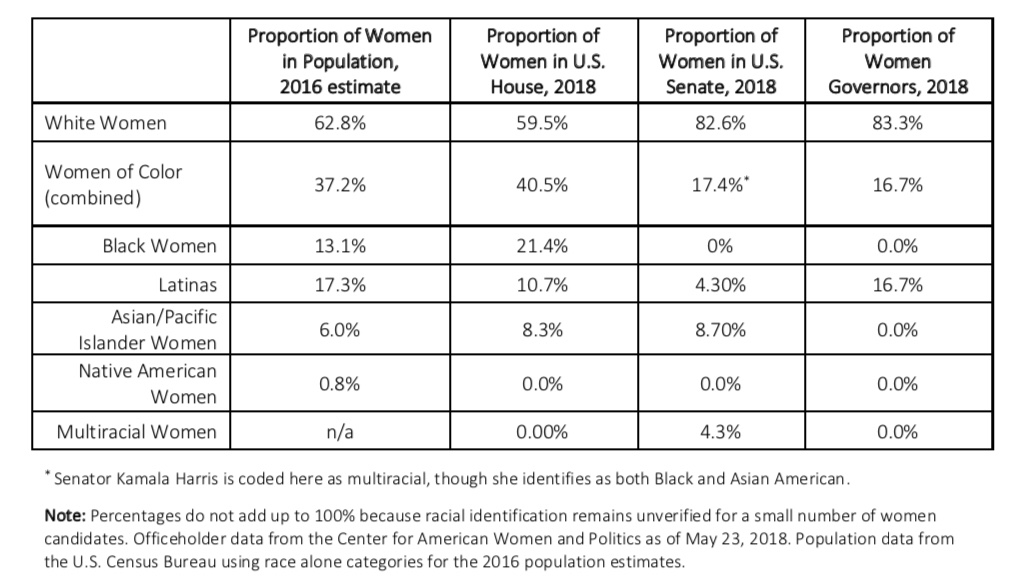 The underrepresentation of women in American politics cuts across racial and ethnic groups. As the table here shows, a significant gap exists for each racial and ethnic group between women’s representation in the U.S. population and their representation across levels of office.
However, the dearth of women of color has been historically stark and persistent in statewide elected executive and U.S. Senate offices. To date, just 5 (5D) women of color have served in the U.S. Senate, with three entering office in 2017. 33 (24D, 9R) women of color have ever served in statewide elected executive office, including just 2 (2R) women of color who have served as governors.
Even in the U.S. House, where women of color are 16.1% of Democratic members and 51% of female Democrats, there is significant progress left to be made. Today, 33 states have no women of color in their congressional delegations (11 states have no women at all), and 30 states have never sent a woman of color to Congress.
Will the 2018 election change these numbers? It’s too early to make accurate predictions of success in November, but we have our first cut at the racial and ethnic diversity in this year’s congressional and gubernatorial candidate pool. The data reflect trends similar to gender and racial disparities among officeholders:
- Women of color are proportionately represented among women running for the U.S. House, though women are underrepresented overall; and
- Women of color are underrepresented among women and among all candidates running for the U.S. Senate and governor.
In early results, our data show that the success rates of women primary candidates vary by race and office. Of particular note, black and white women have the highest win rates thus far in U.S. House races and women of color are 3 of 4 gubernatorial nominees selected as of May 23.
We break down the data (as of May 23, 2018) by level of office below, accounting for the diversity among major party women candidates of different racial groups as well as the types of races in which they are competing. These data include women who have already lost their primaries in order to count them among all of the women who have run for office this year. Our count of total candidates also includes a small number of women for whom we have no racial identification.[i]
| U.S. House | U.S. Senate | Governor |
U.S. House
Today, women of color are 40.5% of women members of the U.S. House and 7.8% of all members. Among all major party filed candidates for the U.S. House (36 states) this year, women of color are 34.3% of all 399 women candidates and 9.5% of all 1725 candidates (male and female).
- They are 35.5% of filed Democratic women and 11.3% of filed Democrats; 31% of filed Republican women and 4.1% of filed Republicans.
- Democratic women of color House candidates are more likely than White women to be incumbents; 22.6% of Democratic women of color versus 11% of white women Democrats are running as incumbents. 26.8% of Democratic Black women candidates filed for the U.S. House in 2018 are incumbents.
- Among Republican House candidates, however, 93.5% of women of color are non-incumbents compared to 78.7% of white women.
- Women of color are one-third of all women non-incumbent candidates, a slightly smaller proportion than they are of all candidates.
When likely candidates (not yet filed) are included, these numbers change little. Women of color are 34% of filed + likely women candidates. They are 35.8% of filed + likely Democratic women and 28.7% filed + likely Republican women.
Proportion of All Women Candidates for the U.S. House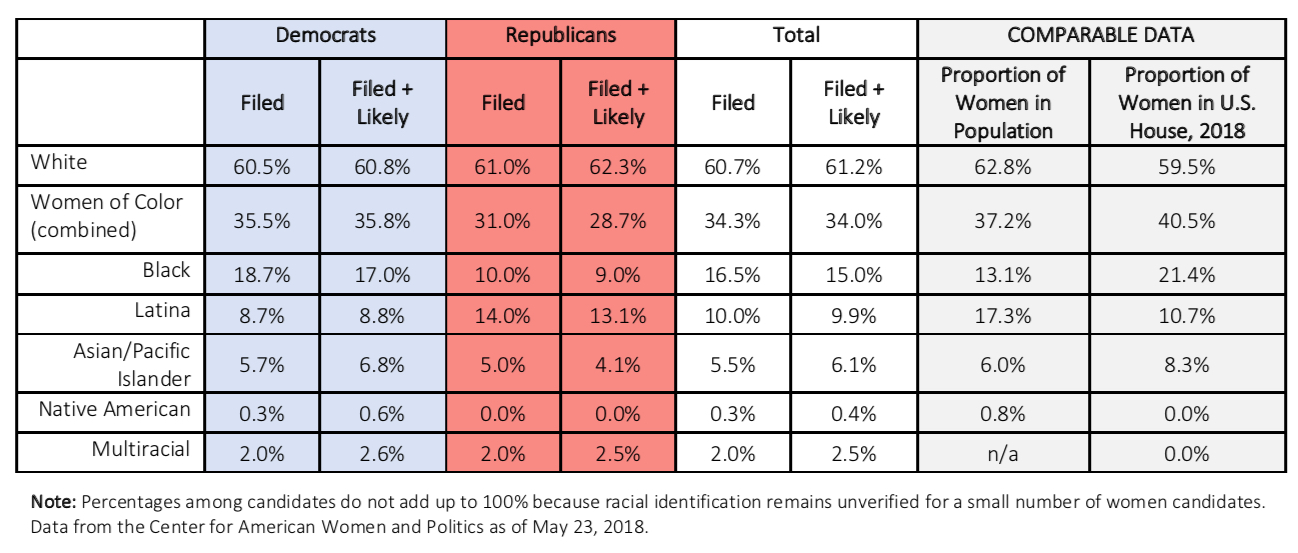
Among all filed candidates for the U.S. House (36 states), white women are 60.7% of all women candidates and 14.3% of all candidates (male and female). By comparison, they are about 61% of women in the U.S. population and 32% of the total population. Today, white women are 59.5% of women members of the U.S. House and 11.5% of all House members. The proportion of White women increases only slightly (to 61.2%) when filed + likely candidates are included.
Women as a Proportion of All Candidates (Male and Female) Filed for the U.S. House (as of May 23, 2018)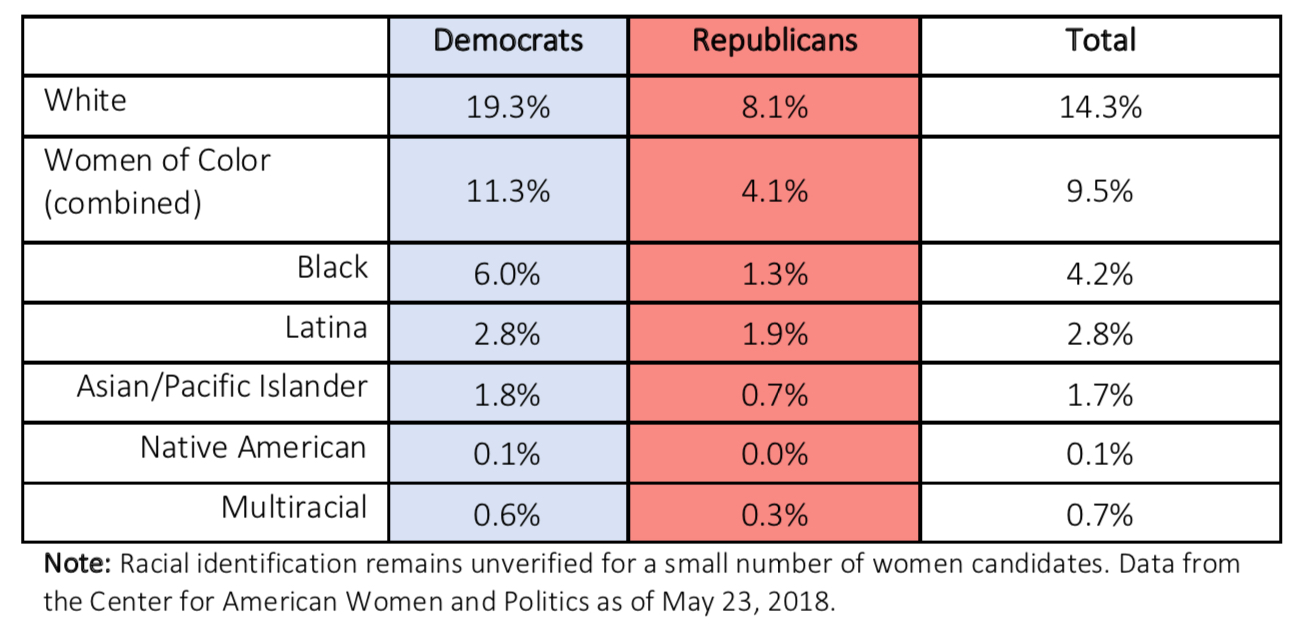
In 13 primaries to date, 43.4% of women of color won nominations in U.S. House contests. 36.2% of women of color non-incumbents won major party House nominations. Black women have the highest win rate overall when incumbents are included; 55.6% of Black women candidates have secured nominations compared to 48% of White women, for example. Among non-incumbents, however, the win rate for black and white women is the same at 42.9% and lower for Latinas, asian/pacific islander, and multiracial women.
Success Rates for Women Candidates for the U.S. House (as of May 23, 2018)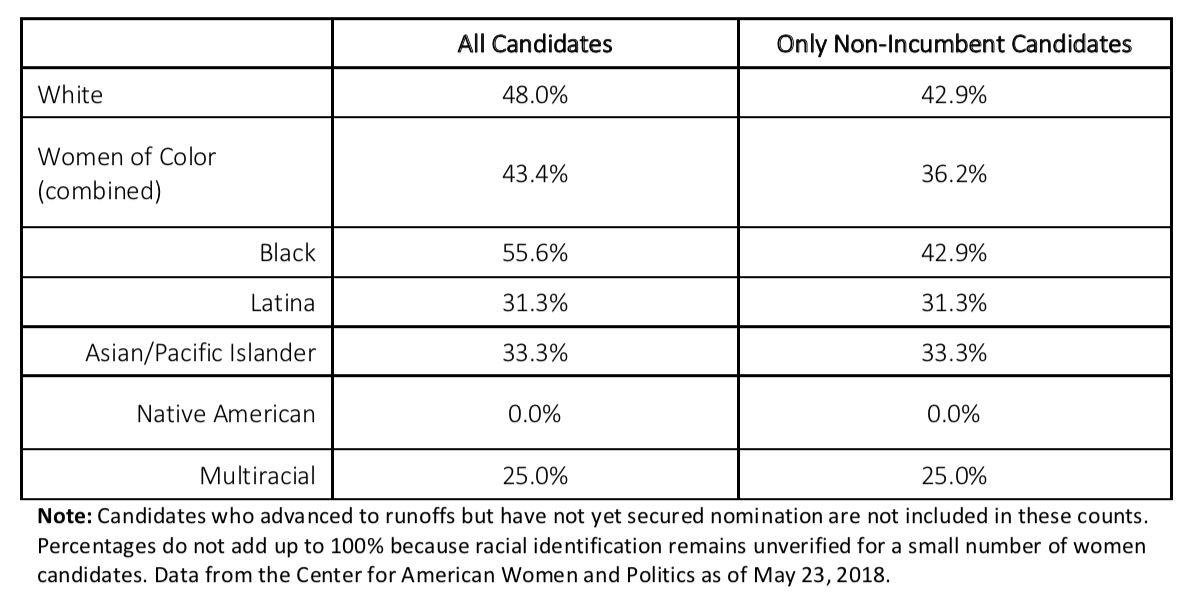
Women of color were 32.3% of all women House nominees in 2016. They are 31.9% of women nominees selected already in 2018.
U.S. Senate
Women of color are 17.4% of women members of the U.S. Senate today. They are 25% of all 36 major party women candidates who have filed to run for the U.S. Senate this year (across the 36 states where filing deadlines have passed).
- They are 28.6% of filed Democratic women and 20% of filed Republican women.
- As of May 23, all women of color candidates who have filed for the U.S. Senate are non-incumbents. There is just one woman of color Senate incumbent up for re-election this year – Mazie Hirono (D-HI).
When likely candidates (not yet filed) are included, these numbers change little overall. Women of color are 22.2% of all 54 filed + likely women candidates. However, the representation of women of color among Republican women declines when likely candidates are included in these counts. Among all filed + likely candidates, women of color are 29% of filed + likely Democratic women and 13% filed + likely Republican women.
Proportion of All Women Candidates for the U.S. Senate
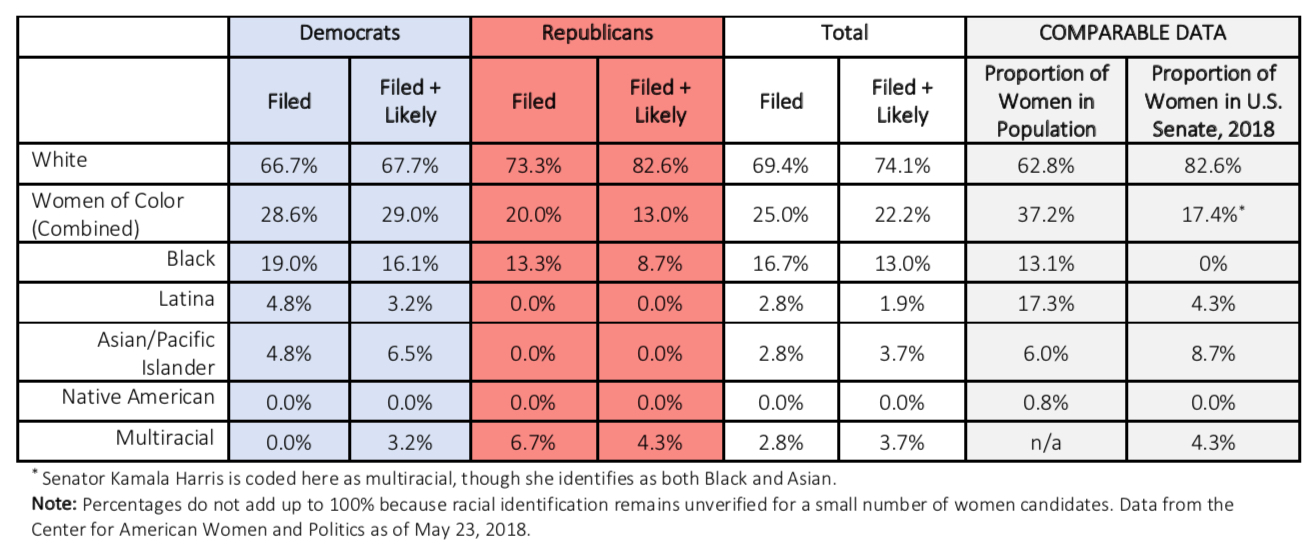
Today, white women are 82.6% of women members of the U.S. Senate. They are 69.4% of all women candidates who have filed to run for the U.S. Senate and 74.1% of all filed + likely women candidates for the U.S. Senate.
Success Rates for Women Candidates for the U.S. Senate (as of May 23, 2018)
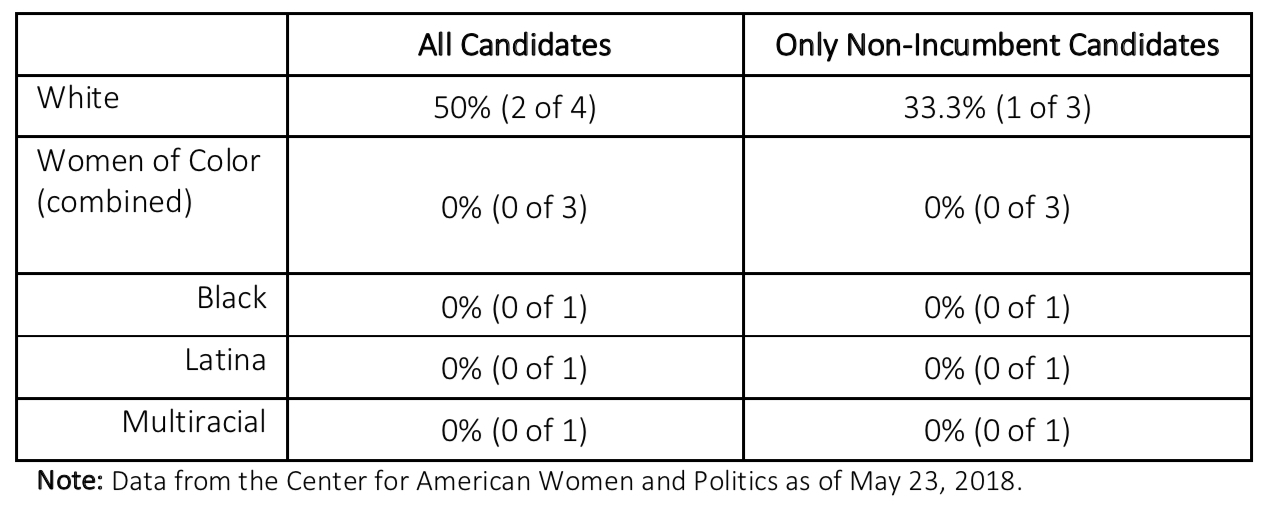
In 13 primaries to date, none of the three women of color candidates for the U.S. Senate were successful. Of the 4 White women who have competed in Senate primaries thus far, 2 – including incumbent Deb Fischer (R-NE) – have secured nominations.
Women of color were 20% of all women Senate nominees in 2016. They are are 0 of 2 women nominees selected already in 2018.
Governor
Just 1 of 6 current women governors (16.7%) is a woman of color: Susana Martinez (R-NM). Women of color are 25.5% of all 47 major party women candidates who have filed for governor this year in the 24 states where filing deadlines for gubernatorial contests have passed.
- They are 35.7% of Democratic women and 10.5% of Republican women who have filed to run for governor.
- The only incumbent woman of color governor – Susana Martinez (R-NM) – is not eligible to run for re-election this year.
Proportion of All Women Candidates for Governor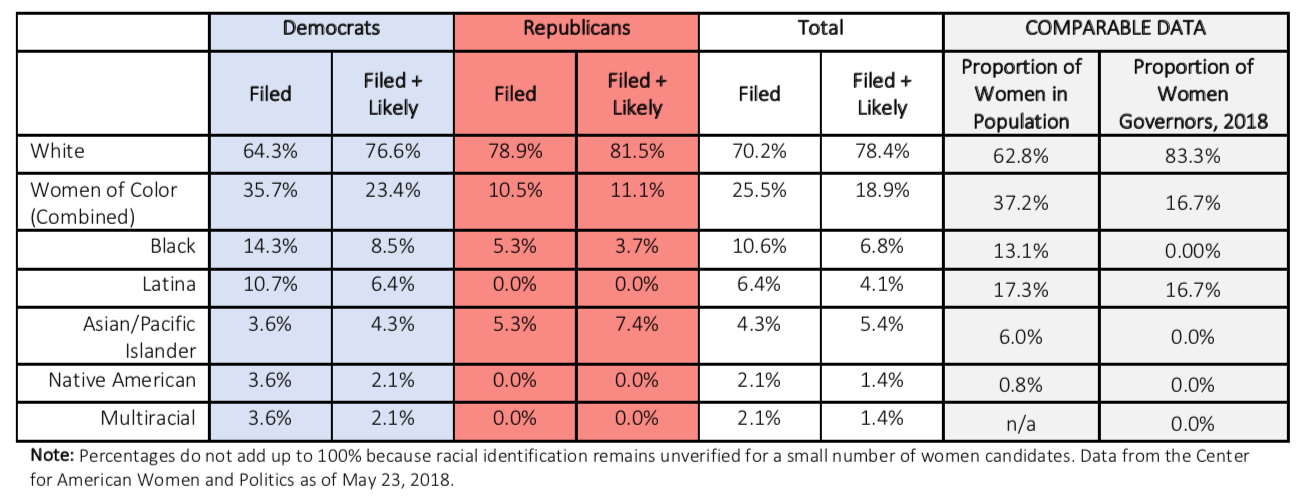
White women are 83.3% of women governors today and 70.2% of all women candidates who have already filed to run for governor this year. Of the 4 (2D, 2R) incumbent women governors running for re-election this year, all are white.
The proportion of women of color candidates for governor drops by about 7 percentage points if all 74 filed + likely women candidates are included. If all are included, women of color are about 18.9% of all women candidates for governor and 23.4% of all Democratic women running for governor.
Success Rates for Women Candidates for Governor (as of May 23, 2018)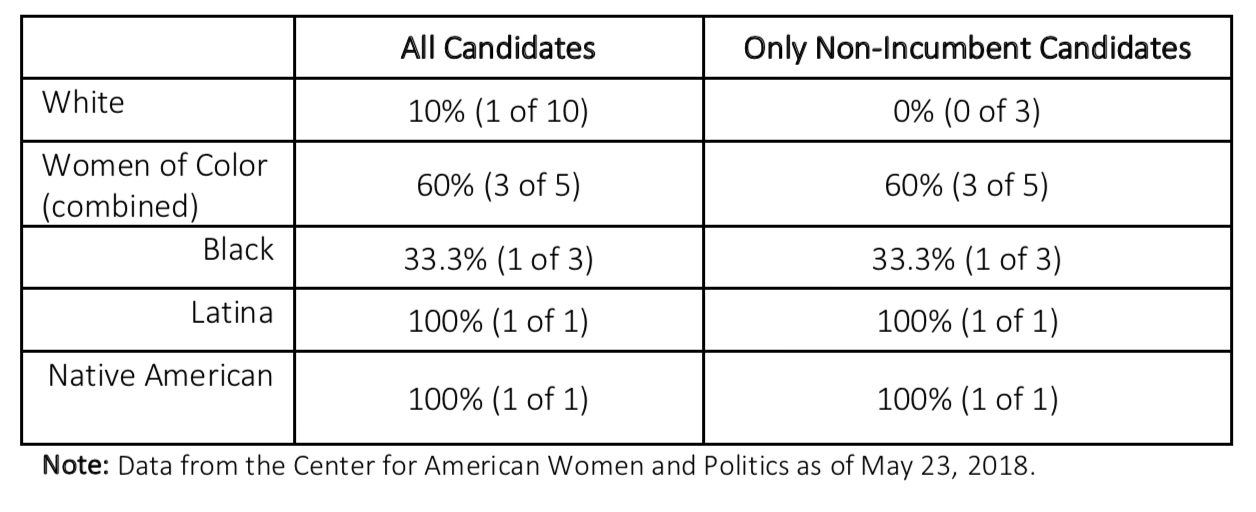
In the 9 gubernatorial primaries to date, 3 of 5 (60%) women of color candidates won nominations for governor, all non-incumbents. Of the 10 White women on gubernatorial ballots to date, just one – incumbent Governor Kate Brown (D-OR) – was successful.
Women of color were 0 of 2 female gubernatorial nominees in 2016 and 2 of 9 (22.2%) women nominees for governor in 2014. They are 66.7% of women nominees selected already in 2018, with 28 gubernatorial primaries left to go.
To monitor women's candidacies throughout election 2018, see CAWP's Election Watch page and watch for additional analyses at Gender Watch 2018, a project of CAWP and the Barbara Lee Family Foundation.
[i] Candidate race was coded by a team of CAWP researchers in two ways. First, we relied on candidate self-identification. Where self-identification was not provided to us, we relied on a multiple source verification process for coding. If verification sources were unavailable or unclear, we left the candidate as uncoded for race identification in our database.